
Figures & data
Table 1. Demographic, clinical and pathological characteristics of bladder cancer patients and samples included in the study.
Figure 1. Relative expression level of genes from PAHS-507 Z and PAHS-004 PCR arrays of precancerous, non-invasive (pTa, pT1), and invasive bladder pT2 tumors.
Note: 4.0-fold change in gene expression was used as cut-off threshold to determine upregulation or downregulation compared to negative control; ‘*’ denotes p < 0.05, ‘**’ - p < 0.01, and ‘***’ – p < 0.001 significant difference in gene expression between pT2 and other bladder cancer samples; ‘^^’ denotes p < 0.01 significant difference in gene expression between pTa and precancerous samples.
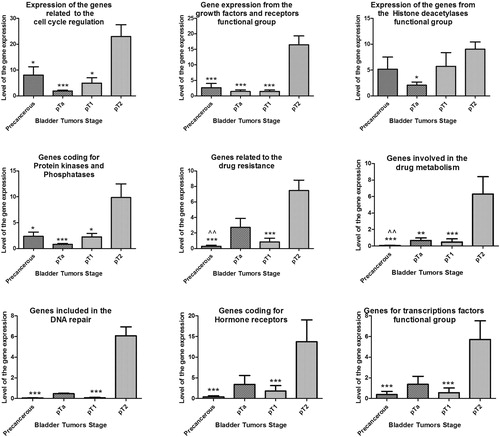
Figure 2. Relative expression levels of genes related to Cancer drug resistance and metabolism; Growth factors and Hormonal receptors; Transcription factors, Cathepsins and Histone deacetylases; PI-3 kinases and phosphatases and Cell cycle proteins of precancerous pools, non-invasive (pTA, pT1) and invasive bladder pT2 tumors.
Note: 4.0-fold change in gene expression was used as cut-off threshold to determine upregulation or downregulation compared to negative control.
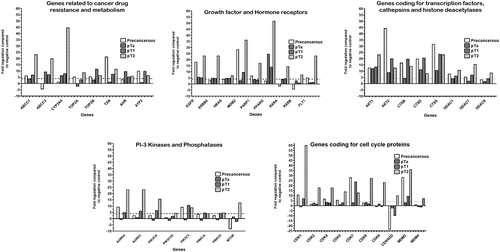
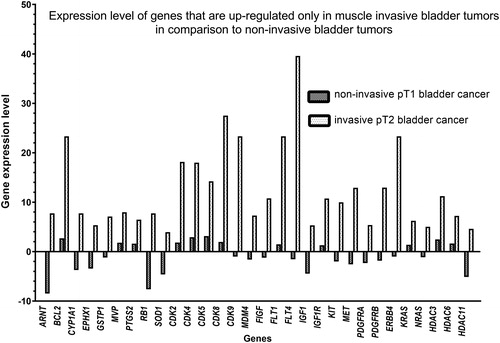
Figure 3. Relative expression level of genes of PAHS-507 Z and PAHS-004 PCR chips of non-invasive (pT1) and muscle-invasive (pT2) bladder tumors.
Note: 4.0-fold change in gene expression was used as cut-off threshold to determine upregulation or downregulation compared to negative control.
Availability of data and materials
The data that support the findings of this study are available from the corresponding author, upon reasonable request.