Figures & data
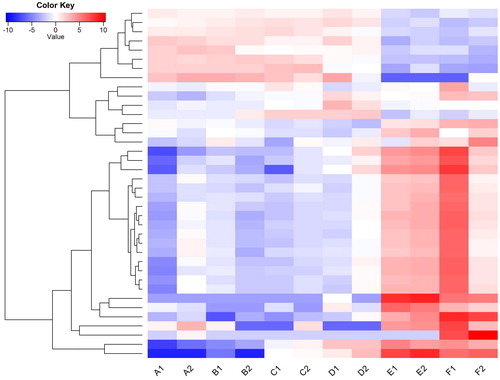
Figure 1. Length distributions of daylily unique transcripts.
Note: The X-axis lists the length of transcripts, and Y-axis lists the numbers of transcripts. Red bars represent the total number of transcripts at specific length ranges, and the adjacent blue bars represent the ones annotated.
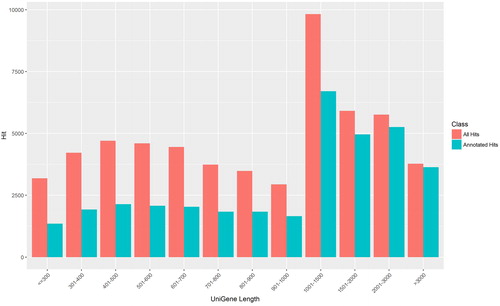
Table 1. Summary of de novo assembled the daylily transcriptome.
Figure 2. GO annotation results of daylily unique transcripts.
Note: GO terms are listed along the X-axis, and the numbers of transcripts grouped in the GO terms are shown on the Y-axis. Red bars represent Biological processes; Green bars represent Molecular functions; and blue bars represent cellular components.
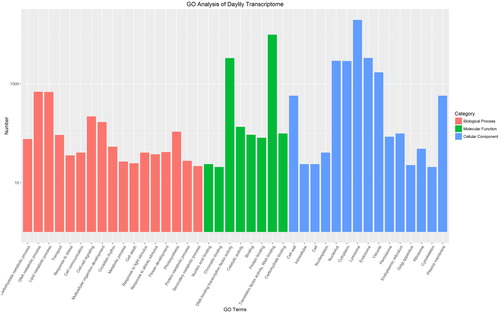
Figure 3. Heatmap showing expression profiles of differentially expressed genes during daylily flower development.
Note: The heatmap was generated using R gplots package; the FPKM values of each gene were normalized and used as input. The color transition from dark blue to dark red represents the expression level of genes from the lowest to the highest.
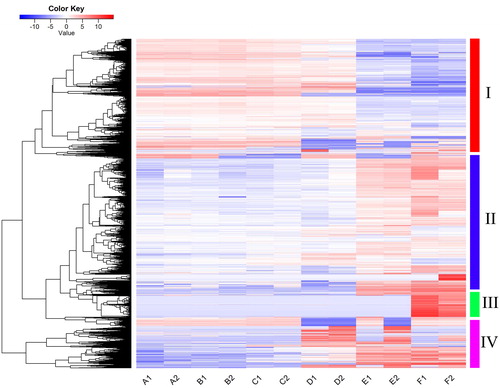
Figure 4. Heatmap showing expression profiles of differentially expressed genes involved in cell wall metabolism during flower development.
Note: The genes that were grouped into the GO term (GO:0071554) were identified as cell–wall metabolism genes. Their expressional levels (FPKM values) were normalized, and used as input to generate the cluster plot. Color annotations are the same as those in .