Figures & data
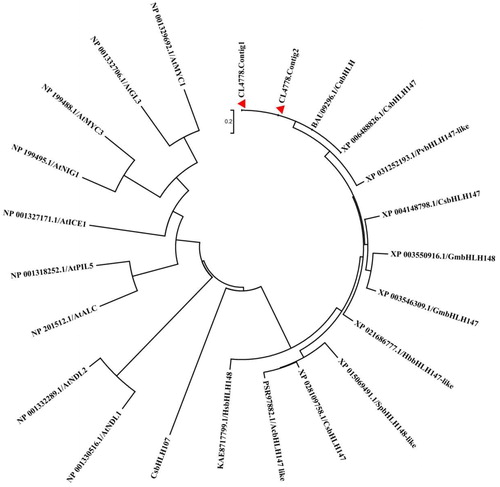
Figure 1. Differentially expressed genes between ‘Guanxi’ pummelo and red-fleshed pummelo. The genes were divided into three classes. Red dots indicate genes that were upregulated, i.e. the gene’s expression in red-fleshed pummelo was higher than in ‘Guanxi’ pummelo. Blue dots indicate genes that were downregulated, i.e. the gene’s expression in ‘Guanxi’ pummelo was higher than in red-fleshed pummelo. Grey dots indicate genes that were not differentially expressed. The horizontal coordinates refer to the average FPKM value (A) and the vertical coordinates refer to the log2ratio (M).
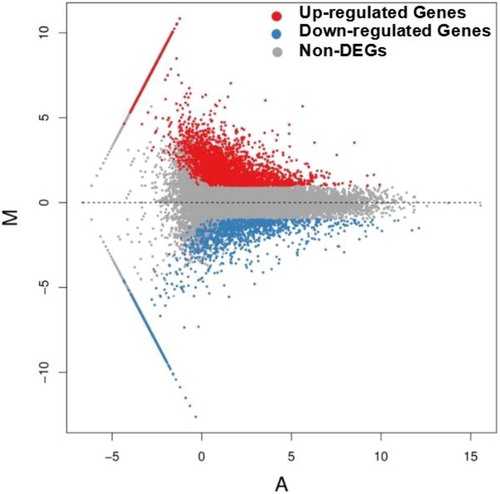
Table 1. Annotation summary of predicted protein numbers from various databases.
Figure 2. GO classifications of DEGs. Unigenes were assigned to three categories: cellular components, molecular functions and biological process.
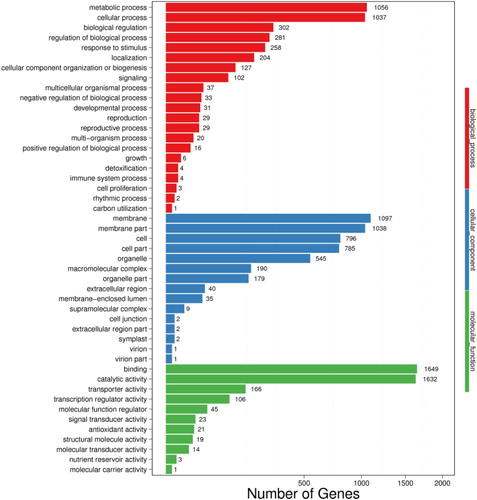
Figure 3. Differences in the expression levels of genes in the carotenoid biosynthetic pathway.
Note: Arrows show the metabolic stream; left or upward arrows represent the genes catalysing the process; the light color indicates that these genes are in the assembled unigenes; the numbers represent the increased expression in red-fleshed pummelo compared with ‘Guanxi’ pummelo.
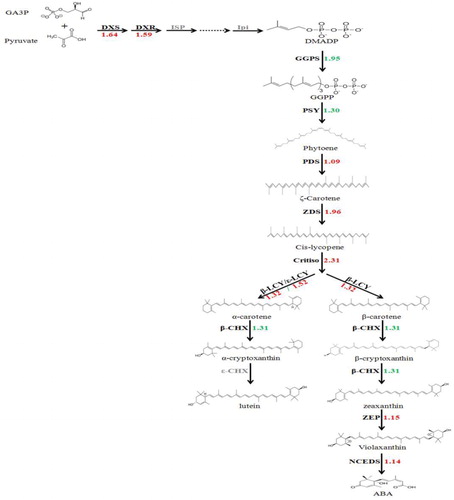
Figure 4. Phylogenetic relationships of the deduced amino acid sequences of bHLH proteins in pummelo and bHLHs in other species.