Figures & data
Figure 1. The distribution of repeat unit and repeat number for EST-SSRs in cv. Jiuxiang transcriptome. (A) Distribution of repeat units for mono-, di-, tri-, tetra-, penta- and hexa-nucleotide. (B–E) Distribution of the repeat number for mono- (B), di- (C), tri- (D), and hexa-nucleotides (E).
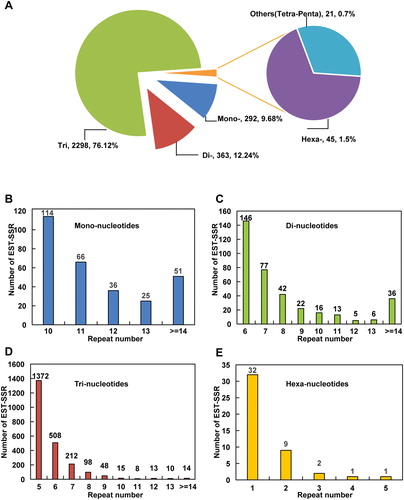
Table 1. Statistic of EST-SSR detected in ‘Jiuxiang’.
Table 2. Frequency of mono-, di- and trinucletide EST-SSR repeat motifs in cv. Jiuxiang.
Figure 2. Expression patterns of DE-EST-SSRs after C. fructicola inoculation. (A) Heatmap of differentially expressed EST-SSRs. (B) Venn diagram of differentially expressed EST-SSRs. (C) Expression trends of 13 differentially expressed EST-SSRs at 24, 72, and 96 Hpi.
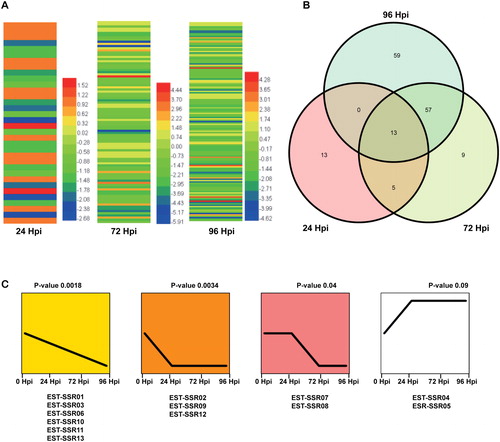
Table 3. Information about 13 differentially expressed EST-SSRs in all three libraries (24, 72 and 96 Hpi).
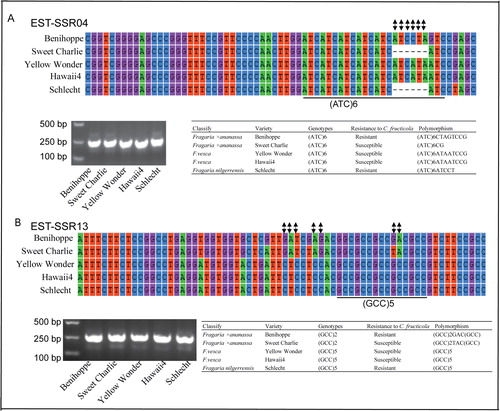
Figure 3. Genotyping of EST-SSR04 and EST-SSR13 in different cultivars and species by PCR and PCR products sequencing. The same EST-SSR with differential SSR genotypes but the same amplicon length. The nucleic acid bases of SSR loci are shown in different colors and the nucleotide substitution variations are shown in black.