Figures & data
Figure 1. Phylogenetic and conserved domain analysis of the S. turcica xylanase GH11 family of genes. (a) Phylogenetic tree constructed based on the neighbour-joining method to show the relationship between the S. turcica xylanase GH11 family and other accessions. (b) Predicted conserved domain structure of the five genes. Catalytic GH11 domains (the blue part) and the signal peptide (the red part) were drawn to represent their relative positions along the chains of family GH11 xylanase genes. The active site (the yellow part) was analyzed for the prediction of conserved domain structures, which was measured in bits.
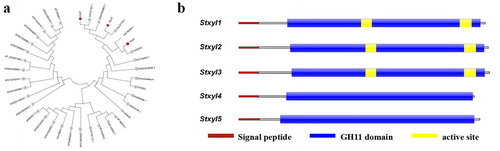
Figure 2. Prokaryotic expression of recombinant Stxyl1 and Stxyl2. (a) SDS–PAGE analysis of recombinant Stxyl1 and Stxyl2 at different conditions. (b) Quantitative activity of two xylanases obtained from prokaryotic expression system with the method of DNS. (c) Quantitative activity of two xylanases obtained from prokaryotic expression system by measurement of the optical density at 540 nm (OD540) of the reaction solution. Data are expressed as means with standard errors from three independent experiments.
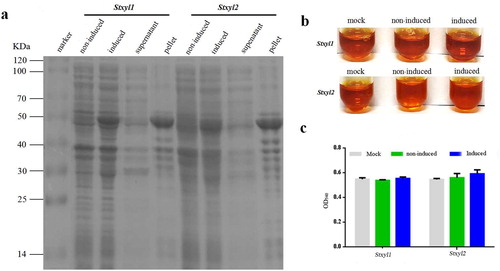
Figure 3. Yeast surface displaying of recombinant Stxyl1 and Stxyl2. (a) Pattern of yeast surface display system. The protein of interest (xylanase) can be displayed on the yeast cell surface by fusion of its N-terminal end to the C-terminus of Aga2p. (b) Western blot analysis of the expression levels of two xylanases, Stxyl1 and Stxyl2. (c) Qualitative detection of the activity of two xylanases obtained from yeast surface display of recombinant Stxyl1 and Stxyl2 with the method of DNS. (d) Quantitative measurement of the activity of two xylanases obtained from yeast surface display of Stxyl1 and Stxyl2 based on the optical density at 540 nm (OD540) of the reaction solution. Data are expressed as means with standard errors from three independent experiments. (***) P < 0.001.
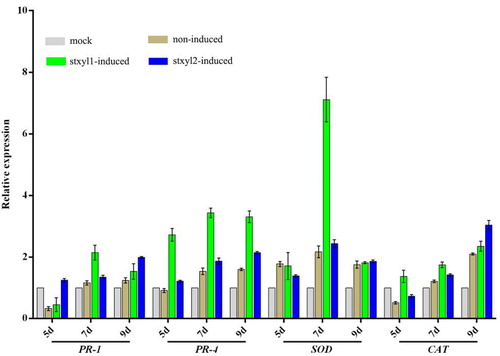
Figure 4. Expression analysis of defence genes in corn treated with yeast surface displaying xylanase. RT-qPCR analysis of the genes PR-1, PR-4, SOD and CAT transcript levels during corn leaves being treated with yeast surface displaying xylanase for 5d, 7d and 9d, respectively. Expression levels were normalized to the expression of the reference gene tubulin. Results are shown as mean ± SD for three independent replicates. Statistical significance compared with control was assessed using one-way ANOVA followed by Student–Newman–Keuls tests.