Figures & data
Table 1. DEGs of kanamycin antibiotic-induced oxidative burst in etiolation of seedling leaves.
Figure 1. Effect of kanamycin treatment on Arabidopsis seedling (A) and root (B and C) growth.
Note: Seedling growth (A): Seeds were sown on 0 (CK), 2.5, 10, 30, 40 and 50 mg/L kanamycin plates. Root growth (B and C) on kanamycin-containing plates: Root length was measured after 10 d growth. Data points show mean standard deviation, n = 3 for every concentration.
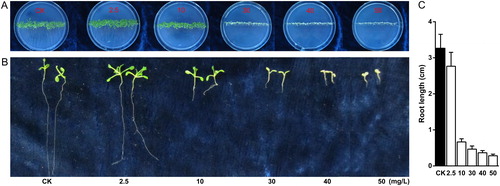
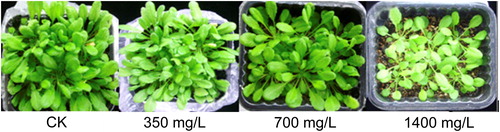
Figure 2. Kanamycin suppresses plant growth.
Note: Arabidopsis seedlings were grown on soil for 21 days then irrigated with 0, 350, 700, and 1400 mg/L kanamycin solution. The picture was taken after 30 d growth.