Figures & data
Figure 1. Flow chart of bioinformatics analysis.
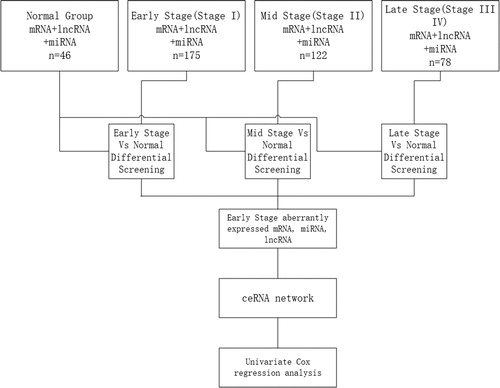
Figure 2. Venn diagram analysis of aberrantly expressed lncRNAs (A) and miRNAs (B) between T1 stage/Normal, T2 stage/Normal, T3 stage/Normal and T4 stage/Normal. T1, T2 and T3 represent the early-stage group, the mid-stage group and the late-stage group, respectively.
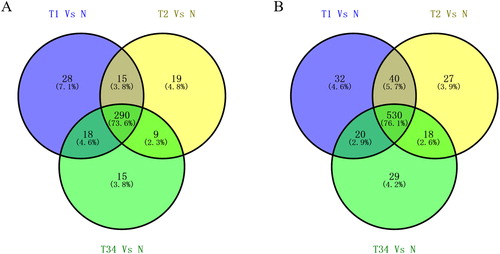
Figure 3. List of 28 differentially expressed miRNAs between normal tissues and T1 stage tissues in LUSC. T1 represents the early stage group. The data are shown as mean values.
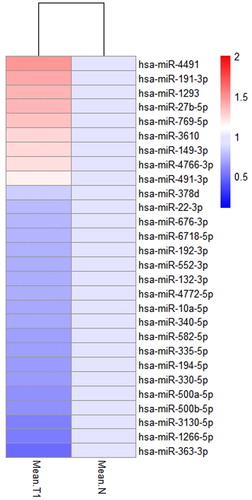
Figure 4. List of 32 differentially expressed lncRNAs between normal tissues and T1 stage tissues in LUSC. T1 represents the early stage group. The data are shown as mean values.
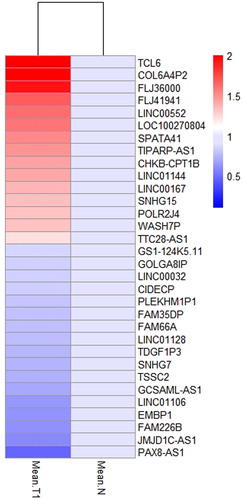
Figure 5. Kaplan–Meier survival curves for four miRNAs (hsa-miR-22-3p, hsa-miR-27b-5p, hsa-miR-340-5p and hsa-miR-552-3p) associated with overall survival. Horizontal axis: overall survival time, days; Vertical axis: survival function.
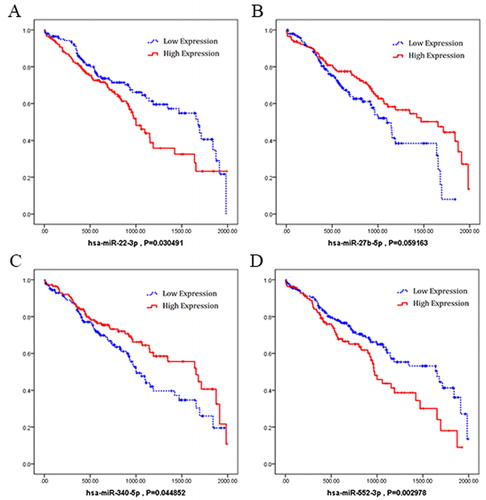
Figure 6. Kaplan–Meier survival curves for six lncRNAs (CHK8-CPT1B, FLJ36000, LINC00167, SNHG15, TTC28-AS1 and WASH7P) associated with overall survival. Horizontal axis: overall survival time, days; Vertical axis: survival function.
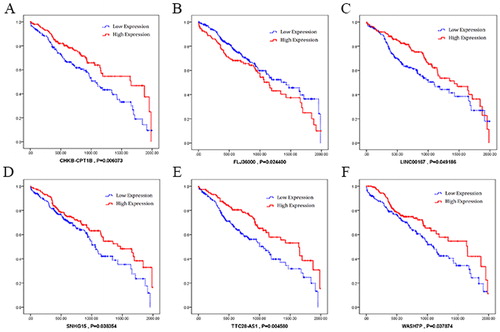
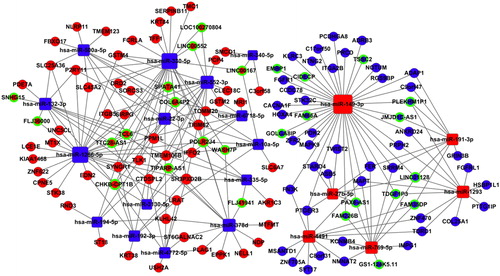
Figure 7. The ceRNA networks in LUSC. Blue squares represent the down-regulated miRNAs; blue balls represent the down-regulated mRNAs; blue balls surrounded by green rings represent the down-regulated lncRNAs. Red diamonds represent the up-regulated miRNAs; red balls represent the up-regulated mRNAs; red balls surrounded by green rings represent the up-regulated lncRNAs.