Figures & data
Table 1. Primers used in this study.
Table 2. Factors and levels for optimization of BpFae production.
Figure 1. Multiple sequence alignment of BpFae and three similar esterases with known crystal structures on the amino acid level. The aligned sequences were derived by the MEGA X software and visualized by the ESPript 3 programme. MHETase-6QG9 from Ideonella sakaiensis; AoFae-6G21from Aspergillus oryzae; FaeB-3WMT from Aspergillus oryzae. The conserved G-X-S-X-G motif and the putative catalytic triad (S209, D492 and H455) is boxed in and indicated by stars.
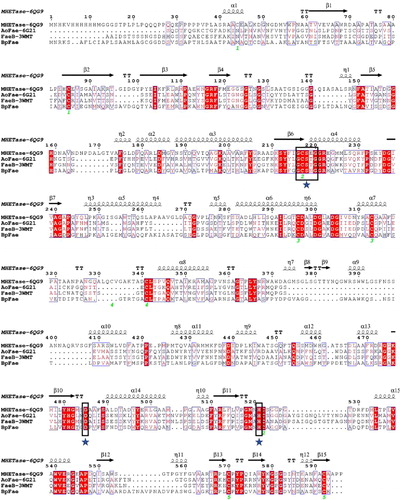
Figure 2. Phylogenetic relationship of BpFae and other well characterized feruloyl esterases derived from bacteria. The tree was constructed using MEGA X with the neighbor-joining algorithm.
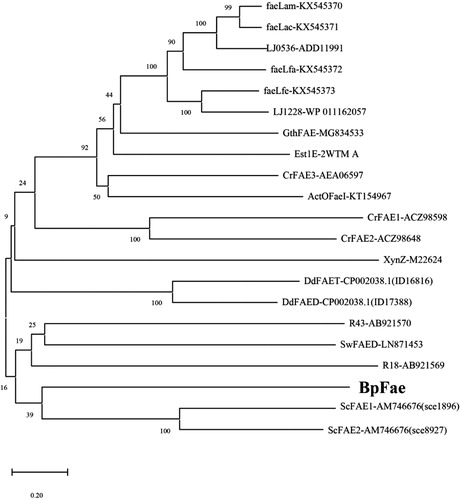
Figure 3. Evolutionary relationship of BpFae to feruloyl esterases derived from eukaryotic microorganism including type A, B, C and D, and some bacterial FAEs contained in the first phylogenetic tree (). The tree was constructed using MEGA X with the neighbor-joining algorithm.
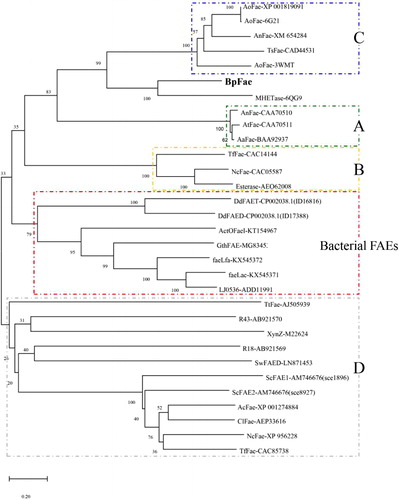
Figure 4. The predicted three-dimensional structure of BpFae by DS sever based on the crystal structure of a MHETase from Ideonella sakaiensis (PDB code 6QG9). The catalytic domain (cyan) and the lid domain (red) are shown. BpFae had a typical α/β hydrolase fold and a Ser-Asp-His catalytic triad (S209, D492 and H455).
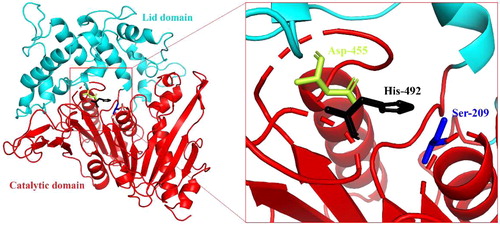
Figure 5. SDS-PAGE analysis of the expression of BpFae in E. coli BL21(DE3) using pET28a vector. M: Molecular weight marker. Lanes 1, 3, 5 and 7: BL21(DE3)-pET-28a; lanes 2, 4, 6 and 8: BL21(DE3)-pET-28a-BpFae. Lanes 1 and 2: supernatant of culture medium; lanes 3 and 4: lysate; lanes 5 and 6: supernatant of lysate; lanes 7 and 8: pellet of lysate. The molecular weight of His-BpFae was predicted as 59 kDa, which was consistent with that as seen in the gel.
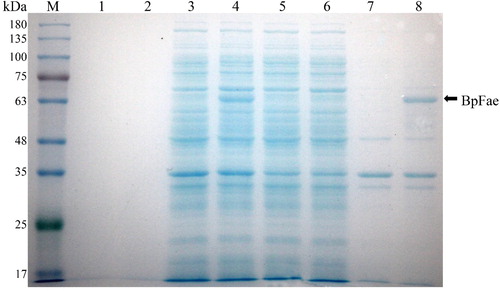
Figure 6. SDS-PAGE analysis of the expression of protein TF-BpFae in E. coli BL21(DE3) using pCold-TF vector. M: Molecular weight marker. Lanes 1, 3, 5 and 7: BL21(DE3)-pCold; lanes 2, 4, 6 and 8: BL21(DE3)-pCold-BpFae. Lanes 1 and 2: supernatant of culture medium; lanes 3 and 4: lysate; lanes 5 and 6: supernatant of lysate; lanes 7 and 8: pellet of lysate. The molecular weight of TF-BpFae was predicted as 111 kDa which was consistent with that as seen in the gel.
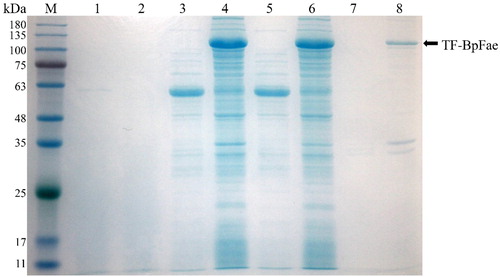
Figure 7. Expression of protein GST-BpFae. (a) SDS-PAGE analysis of the expression of protein GST-BpFae in E. coli BL21(DE3) using pGEX-4T-1 vector. M: Molecular weight marker. Lanes 1, 3, 5 and 7: BL21(DE3)- pGEX-4T-1; lanes 2, 4, 6 and 8: BL21(DE3)- pGEX-4T-1-BpFae. Lanes 1 and 2: supernatant of culture medium; lanes 3 and 4: lysate; lanes 5 and 6: supernatant of lysate; lanes 7 and 8: pellet of lysate. The molecular weight of BpFae without GST tag was predicted as 59 kDa which was consistent with that as seen in the gel. (b) Analysis of FAE activity of all protein fractions expressed by pGEX-4T-1.
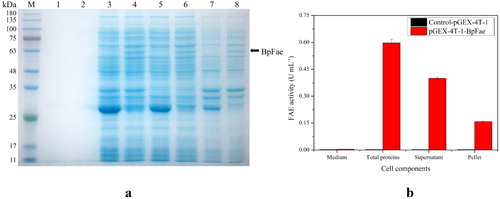
Figure 8. Zymogram analysis of FAEs detected with methyl ferulate as substrates. Samples were supernatant of lysate. 1: pGEX-4T-1-BpFae; 2: pCold-TF-BpFae; 3: pET-28a-BpFae.
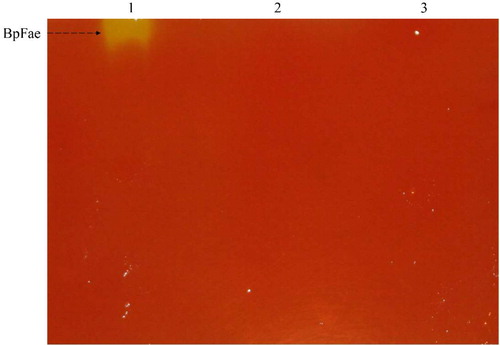
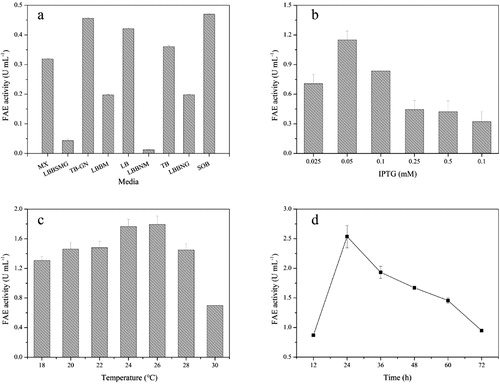
Figure 9. Effect of media (a), IPTG concentrations (b), induction temperatures (c) and induction times (d) on the production of BpFae.0