Figures & data
Figure 1. Phylogenetic analysis of SBP-box proteins among B. juncea, Arabidopsis and Oryza sativa by MEGA7.0. (a) The full-length SBP domain protein sequences from B. juncea (BjuSBP), Arabidopsis (AtSPL) and O. sativa (OsSPL), each of group were aligned by ClustalX, and the branched lines of the subtrees with different colors indicated different SBP-box subgroups. (b) SBP-box family members of B. juncea, Arabidopsis and O. sativa.
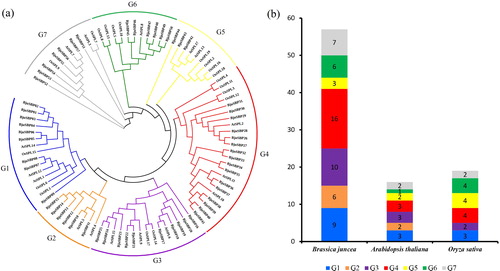
Figure 2. Phylogenetic relationship, exon–intron structure and conserved motifs analysis of SBP-box genes in B. juncea. (a) The phylogenetic tree created by MEGA 7.0 and exon–intron structures from online software GSDS. Also boxes and lines represent exons and introns, respectively. (b) Conserved motifs predicted in BjuSBP protein. The fifteen motifs were identified by MEME program, with each number of colored box representing a different motif.
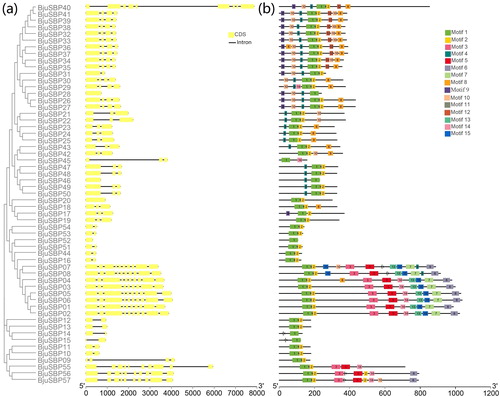
Figure 3. Duplications of BjuSBP genes in the B. juncea chromosomes. The homologous region is represented with different colors. Chromosome numbers are indicated at the top of each bar. The scale bar on the left indicates the size of chromosomes.
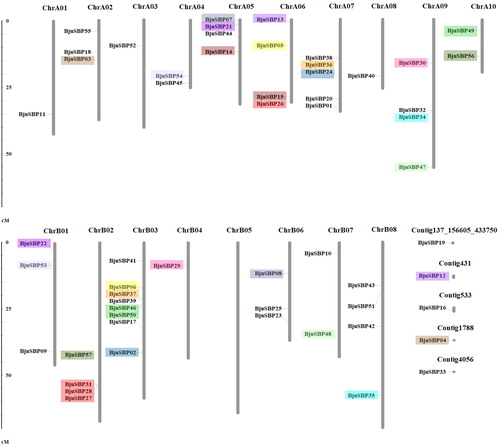
Figure 4. Analysis of the successive duplications of the SBP-box genes in the mustard genome. Among them, 18 chromosomes and four contigs were arranged in a circle with a single color. The gray line connected a pair of duplicate genes generated by doubling the genome. The red line connecting the chromosomes represented the syntenic region of the BjuSBP genes.
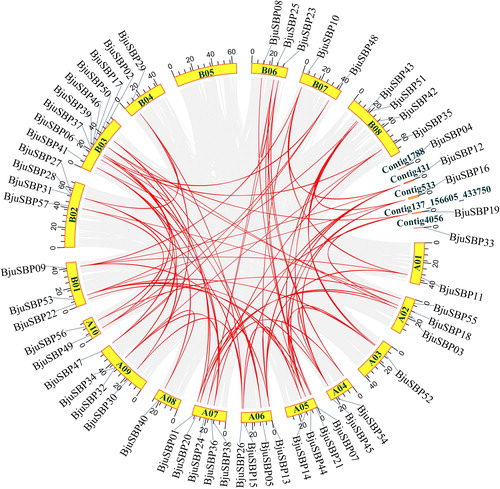
Figure 5. Cis-regulatory elements analysis in the promoter region of BjuSBP genes. (a) The total number of BjuSBPs for each homeopathic element (gray bars), and the total number of BjuSBPs including the corresponding cis-acting element (blue dots). (b) Cis-acting elements are divided into three categories based on functional annotation: plant growth and development, phytohormone responsive, or abiotic and biotic stresses-related cis-acting elements.
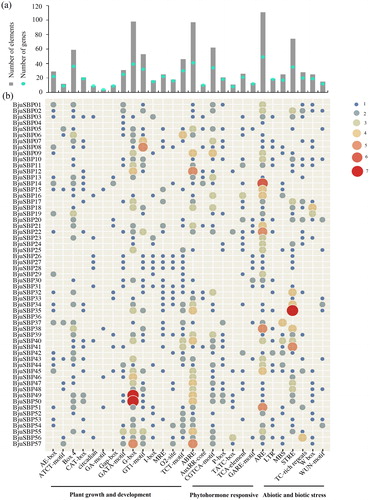
Figure 6. Gene ontology (GO) and functional annotation of BjuSBP genes. According to the GO second level terms, the annotation results are divided into three GO categories, which are represented by different color bars.
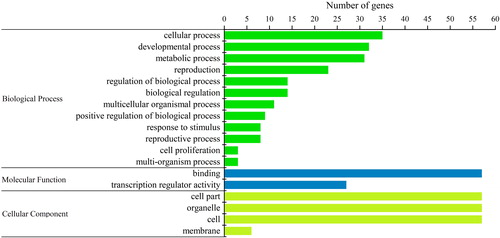
Figure 7. Interaction network of BjuSBP genes in mustard based on the orthologs in Arabidopsis. The up-regulated and down-regulated genes are marked with red and blue blocks, respectively.
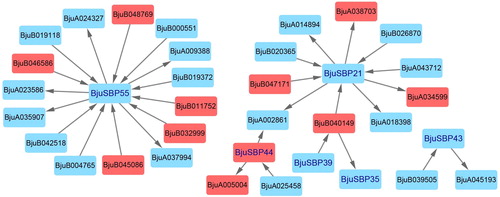
Figure 8. Analysis of collinearity among B. rapa, B. juncea and B. oleracea genomes. Colored circular rectangles denote the chromosomes of three cruciferous plants. All bezier curves connect protein-coding genes in synteny blocks, and some synteny blocks of B. juncea and B. rapa, B. juncea and B. oleracea are removed, which are less than 80 and 60 pairs of homologous genes, respectively. The red curves represent gene pairs that are collinear with some BjuSBP genes.
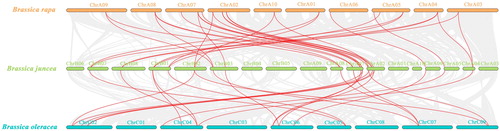
Figure 9. Expression profiles of BjuSBP genes by the analysis of transcriptome data of different developmental stages of mustard. The color scale bar on the right side of the heat map corresponds to the value converted by log2FPKM, where red indicates higher transcription abundance and blue indicates lower.
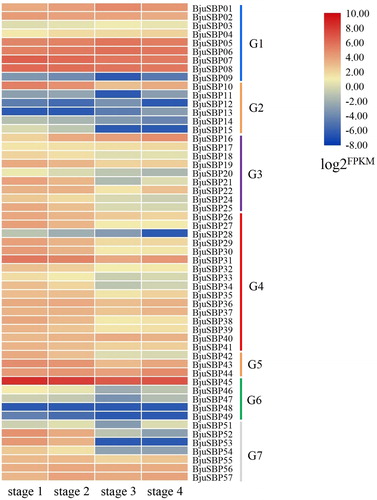
Figure 10. Relative expression of mustard SBP-box genes at different developmental stages.
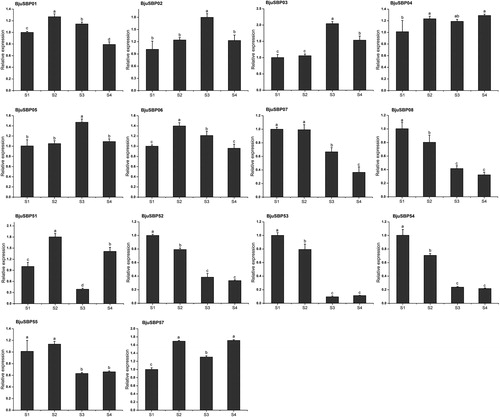
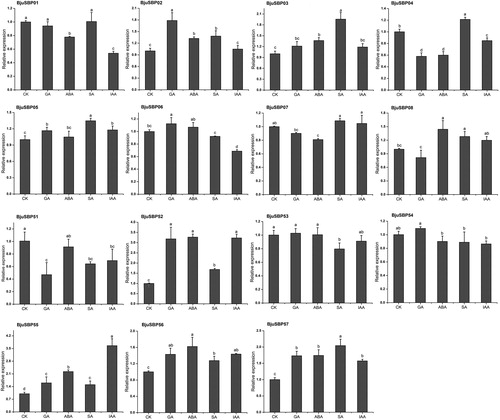
Figure 11. Expression profiles of BjuSBPs in response to treatment with gibberellin (GA), abscisic acid (ABA), salicylic acid (SA) and auxin (IAA).