Figures & data
Figure 1. pCAMBIA3301-Bar-EPSPS vector map.
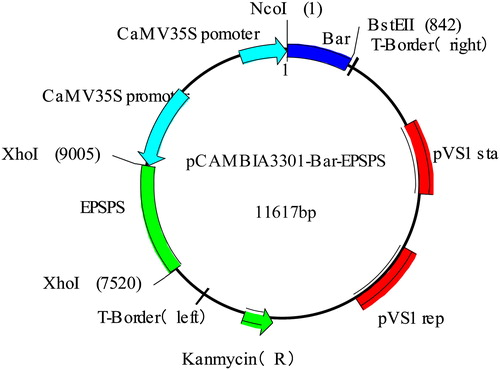
Figure 2. Genetic transformation and domestication and transplanting process of castor bean leaf section.
Notes: (a): castor seeds; (b): ramie peeled seeds inoculated in the medium; (c): the state when the cotyledonary nodes are cut; (d): pre-culture; (e): co-cultivation; (f): resistance screening; (g): domestication and transplanting state; (h) -(i): state after transplanting.
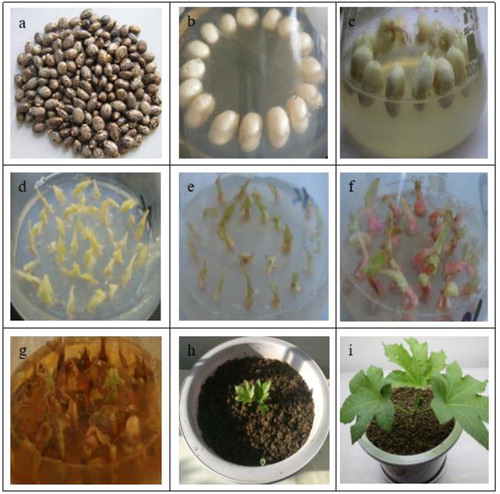
Figure 3. Transgenic plants.
Notes: (a) 2129 transgenic plants; (b) CSR·181 transgenic plants
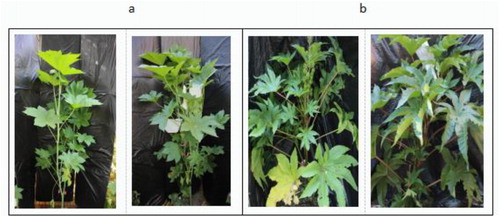
Figure 4. Subcellular localization analysis.
Note: (a): EPSPS protein in non-transformed controls; (b): EPSPS protein protein conversion under bright field conditions; (c): EPSPS protein protein conversion under fluorescent conditions; (d) Bar protein in non-transformed control; (e): protein conversion of Bar protein under bright field conditions; (f): protein conversion of Bar protein under fluorescent conditions
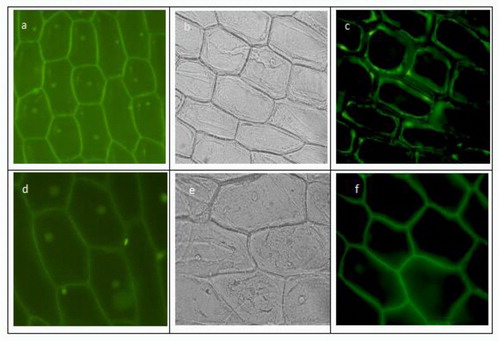
Figure 5. PCR detection electrophoresis results.
Note: (a) 2129-BE + PCR detection electrophoresis results; (b) CSR·181-BE + PCR detection electrophoresis results M: DL 2000 Marker; 1: positive control; 2: negative control; 3-14: 2129-BE + PCR result
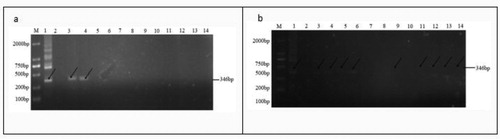
Figure 6. Relative expression of EPSPS and Bar.
Differential expression of EPSPS gene (a) and Bar gene (b) between 2129-BE + and 2129.: Differential expression of EPSPS gene (c) and Bar gene (d) between CSR·181-BE + and CSR·181.
Note: 2129 and CSR·181 are non-transgenic controls; G-1 and G-4 are 2129-BE+; A-1, A- 2. A-3, A-4, A-7, A-9, A-10, A-11, A-12 are CSR·181-BE+.
*Significant differences at P ≤ 0.05;
**Significant differences at P ≤ 0.01.
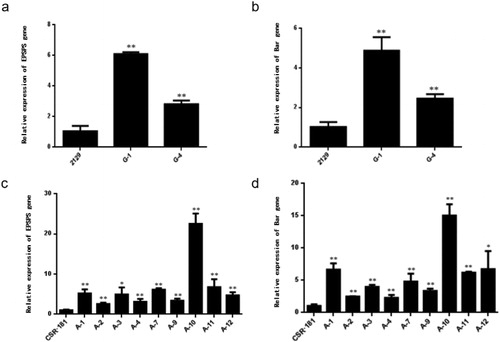
Figure 7. Glyphosate resistance test on leaves of 2129 in vitro.
Excised leaves of 2129 and G-1 exposed to different concentrations of glyphosate in vitro: 0 mg/L (a), 0.8 mg/L (b), 1.0 mg/L (c).
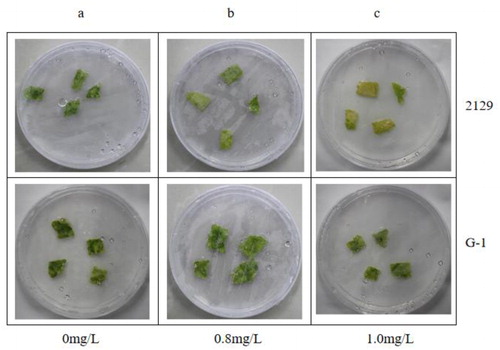
Figure 8. Glufosinate resistance test on leaves of 2129 in vitro.
Excised leaves of 2129 and G-1 exposed to different concentrations of glufosinate in vitro: 0 mg/L (a), 0.5 mg/L (b), 2.0 mg/L (c).
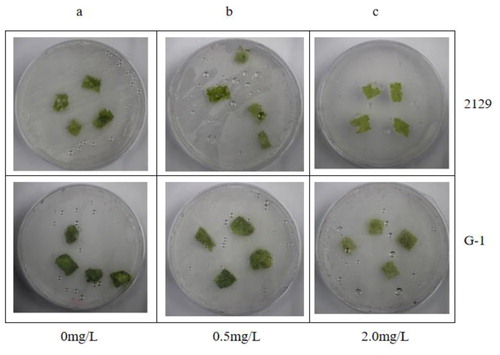
Figure 9. Glyphosate resistance test on leaves of CSR·181 in vitro.
Excised leaves of CSR·181 and A-3 exposed to different concentrations of glyphosate in vitro: 0 mg/L (a), 0.5 mg/L (b), 2.0 mg/L (c).
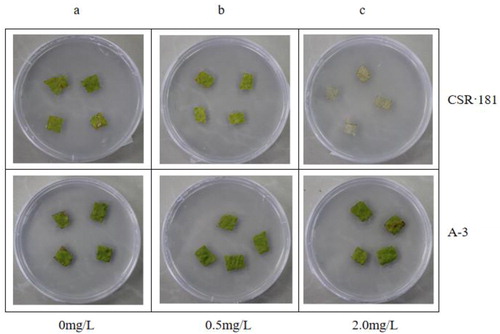
Figure 10. Glufosinate resistance test on leaves of CSR·181 in vitro.
Excised leaves of CSR·181 and A-3 exposed to different concentrations of glufosinate in vitro: 0 mg/L (a), 0.5 mg/L (b), 2.0 mg/L (c).
Note:The experiments were run in parallel, with shared controls, so the images in (9)a and (10)a are given twice for clarity and easier interpretation.
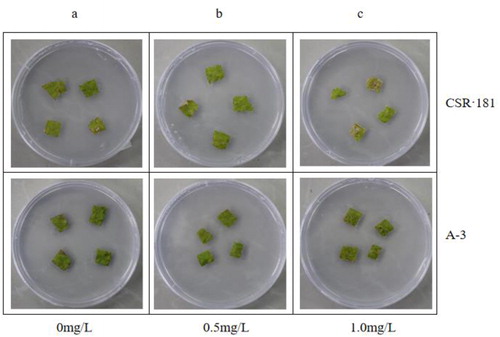
Figure 11. Herbicide resistance in castor plants.
(a) G-1 and 2129 plants not sprayed with glyphosate; (b) G-1 and 2129 plants not sprayed with glufosinate; (c) A-3 and CSR·181 not sprayed with glyphosate; (d) A-3 and CSR·181 not sprayed with glufosinate; (e) G-1 and 2129 plants after spraying glyphosate for 7 days; (f) G-1 and 2129 plants after spraying glufosinate for 7 days; (g) A-3 and CSR·181 plants after spraying glyphosate for 7 days; (h) A-3 and CSR·181 after spraying glufosinate for 7 days
Note:The experiments were run in parallel, with shared controls, so the images a, b, c and d are given twice for clarity and easier interpretation.
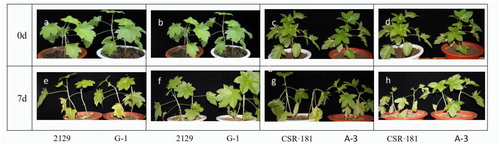
Figure 12. Herbicide resistance in CSR·181 plants. Leaf changes after spraying A-3 and CSR·181 plants with glyphosate (a) or glufosinate (b) for 7 days.
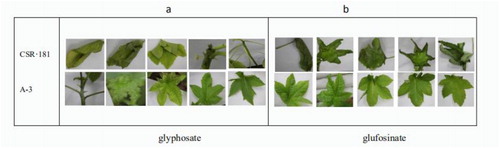
Figure 13. Two-dimensional electrophoresis of CSR·181-BE leaves.
(a): CSR·181 not sprayed with herbicide; (b): CSR·181-BE not sprayed with herbicide; (c): CSR·181 sprayed with glyphosate; (d): CSR·181-BE sprayed with glyphosate; (e) CSR· 181 sprayed with glufosinate; (f): CSR·181-BE sprayed with glufosinate
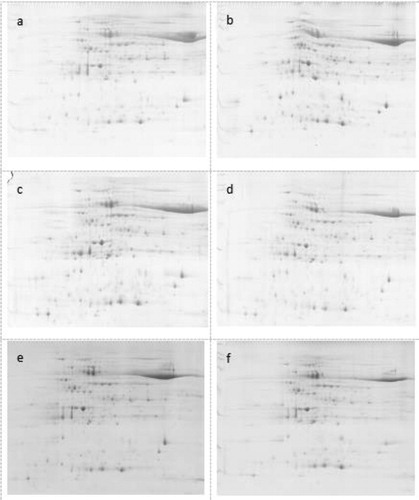
Table 1. Identification of differential proteins in transgenic dwarf double-resistant ramie leaves.
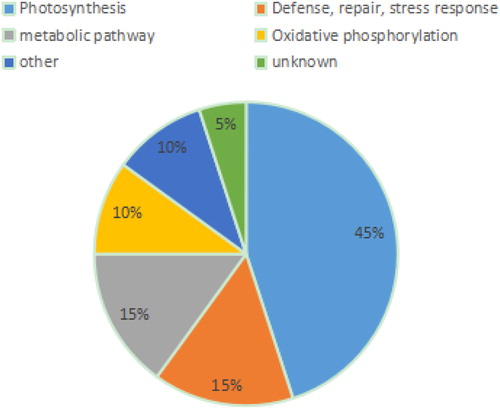
Figure 14. Classification of differentially expressed proteins.