Figures & data
Table 1. Effects of Leucocalocybe mongolica polysaccharides on tumor weight and relative organ indices in H22 tumor-bearing mice.
Table 2. Effect of treatment with Leucocalocybe mongolica polysaccharides on serum cytokine and vascular endothelial growth factor levels in H22 tumor-bearing mice.
Figure 1. Histological examination of the morphological changes in tumors derived from H22-bearing mice. MG, tumor-bearing mice that received saline solution; PG, positive control, received 25 mg/kg body weight of CTX; LD, low dose, received 100 mg/kg body weight of polysaccharide extract from Leucocalocybe mongolica (LMPs); MD, medium dose, received 200 mg/kg body weight of LMPs; HD, high dose, received 300 mg/kg body weight of LMPs. Tumor tissues were stained with hematoxylin and eosin (magnification, 400×) (A) and subjected to the TUNEL assay (magnification, 400×) (B, C). All data are presented as means ± SD (n = 10). *p < 0.05, **p < 0.01 compared with the model group. Scale bar =50 μm.
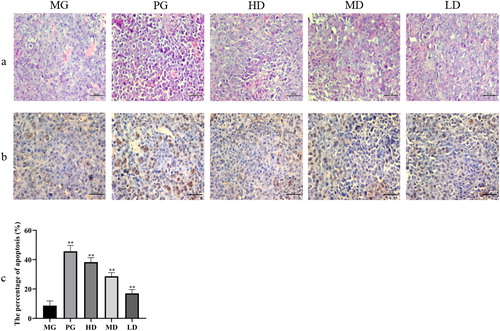
Figure 2. Immunohistochemical staining of tumor tissues and the stained area of the tumor tissues. Data are presented as means ± SD (n = 10). *p < 0.05 and **p < 0.01 compared to the model group. Scale bar =50 μm.
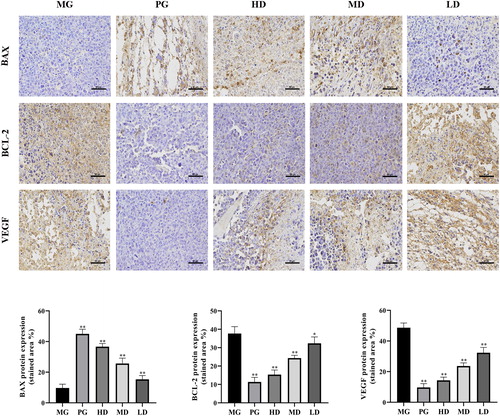
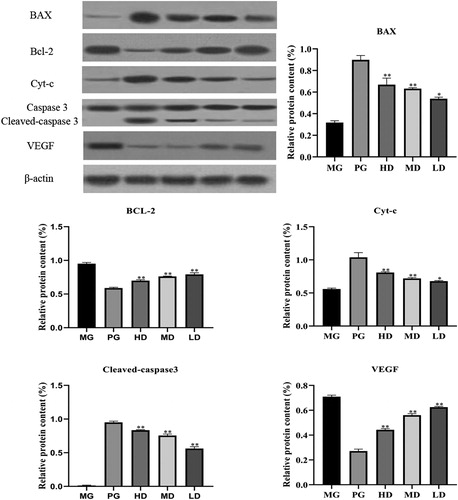
Figure 3. Relative protein expression of Bcl-2-associated X protein (Bax), B-cell lymphoma-2 (Bcl-2), cytochrome C (Cyt-c), caspase-3, cleaved caspase-3 and vascular endothelial growth factor (VEGF) in tumor tissues. β-actin was used as a control. Data are presented as means ± SD (n = 10). * p < 0.05, ** p < 0.01 compared with the model group.