
Figures & data
Table 1. Geographic description of collection sites of S. tonkinensis.
Figure 1. Electrophoretic results of some materials with five pairs of primers (E-ACA-M-CTT, E-AGC-M-CTG, E-ACT-M-CTC, E-ACC-M-CAT and E-AAG-M-CTA).
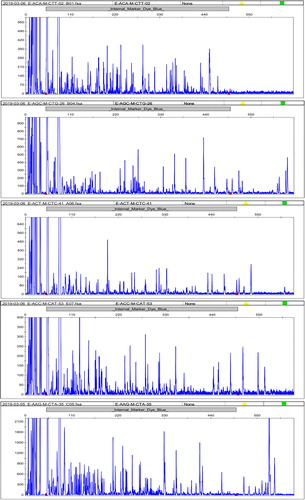
Figure 2. Geographic locations of S. tonkinensis. The colours of circle dots represent the clade to which dots belong. Orange: clade I, Blue: clade II, Red: clade III. Source: Constructed by software DIVA-GIS.
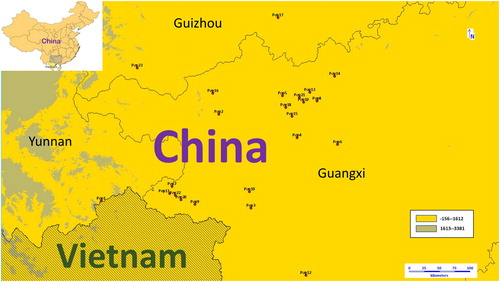
Figure 3. Information on band pattern. Note: The data were processed by GenAlEx 6.5.
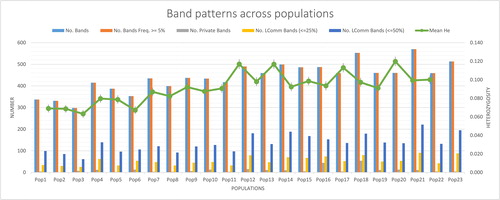
Table 2. Information on band pattern.
Table 3. Percentage of polymorphic loci.
Table 4. Estimated number of allele and Shannon's information index.
Figure 4. Estimated number of subpopulations (K). Note: The studied panel from STRUCTURE 2.3.4 analysis.
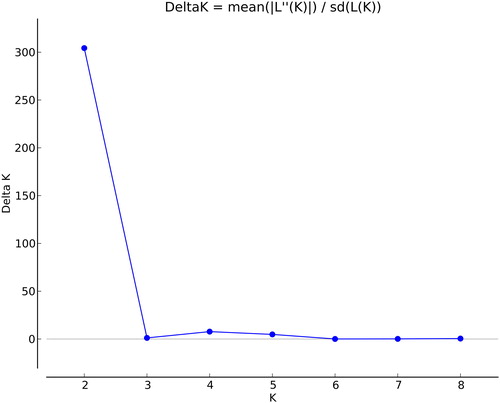
Figure 5. Genetic structure and dendrogram. Note: Genetic structure was constructed using Bayesian method by STRUCTURE 2.3.4 and UPGMA dendrogram was drawn based on Nei’s genetic distance by NTSYS-pc v2.10.
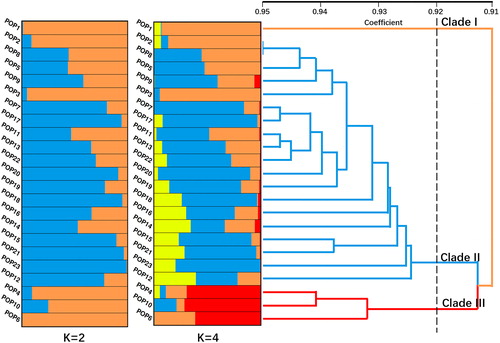
Figure 6. Principal coordinate analysis (PCoA) based on AFLP data. Note: PCoA with Nei’s genetic distance and data processed by GenAlEx 6.5.
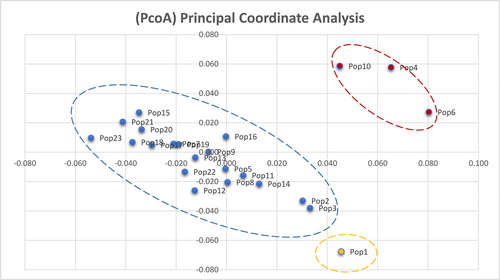
Table 5. Summary of AMOVA.
Table 6. Correlation between genetic distance and eco-environmental distance based on pairwise Mantel test for all populations and populations in clade II and clade III.
Data accessibility statement
The datasets generated in this study are available from the corresponding author on reasonable request. AFLP data can be accessed at: https://datadryad.org/stash/share/CKSepDVRwyqTBd640V8JeBsefycgjWVHOckUmKQ_ec4