Figures & data
Table 1. Details of 135 safflower accessions (Accession name and origin) subjected for genetic diversity analysis.
Table 2. Primers used for sequence-related amplified polymorphism (SRAP) analysis in safflower accessions.
Table 3. SSR markers used for genetic diversity analysis in safflower accessions.
Figure 1. Cluster analysis of 135 safflower accessions based on morphological traits data across two years (2015-2016 and 2016-2017). The x–y coordinates are the principal components, which are linear combinations of the original dimensions.
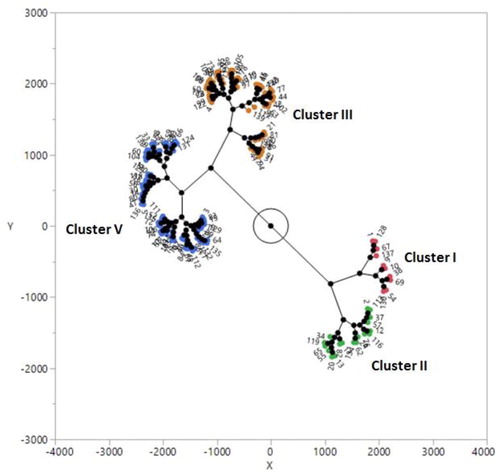
Table 4. Descriptive statistics for agro-morphological traits in 135 safflower accessions evaluated in the field in 2015-2016 and 2016-2017.
Figure 2. PCR amplification profile obtained with SRAP marker (Em2-Me1) (a) and SSR marker (GBCT-184) (b) in safflower genotypes. M: molecular size marker (Cinagen, Iran).
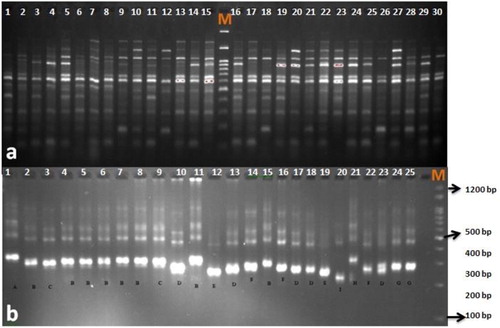
Figure 3. Cluster analysis of 135 safflower genotypes based on genetic dissimilarity matrix obtained by SRAP markers.
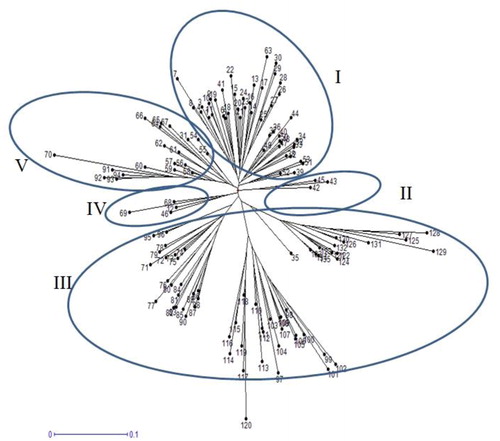
Table 5. Polymorphism characteristics of 10 SRAP primer combinations in 135 safflower accessions.
Figure 4. Cluster analysis of 135 safflower genotypes based on genetic dissimilarity obtained by SSR markers.
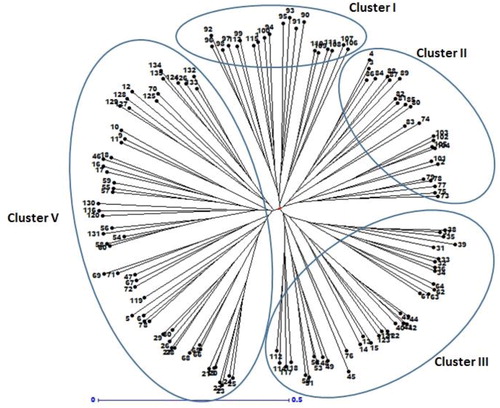
Table 6. Genetic parameters of the 10 polymorphic SSR markers used for genetic diversity in safflower.
Figure 5. Cluster analysis of 135 safflower genotypes based on genetic dissimilarity obtained by combined data (SRAP and SSR markers).
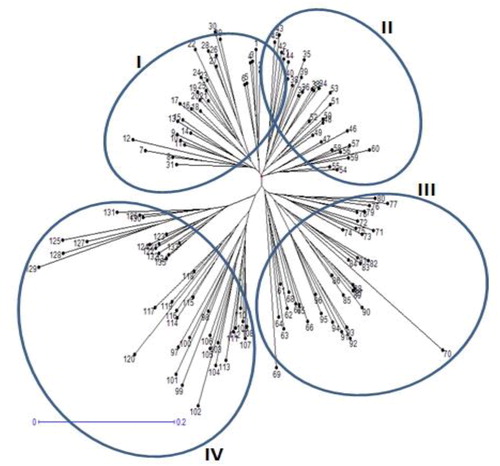
Figure 6. K values based on three independent runs and K ranging from 1 to 10 based on 135 safflower genotypes using SRAP and SSR markers.
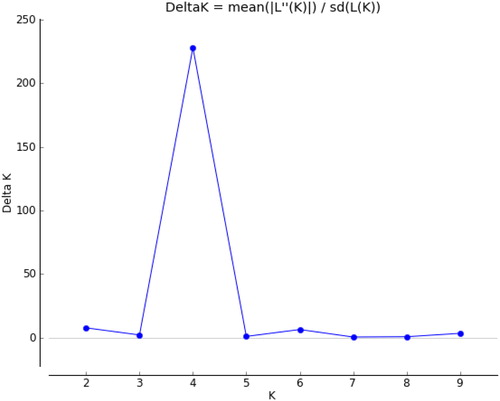
Figure 7. Population genetic diversity of 135 safflower genotypes based on SRAP and SSR markers.
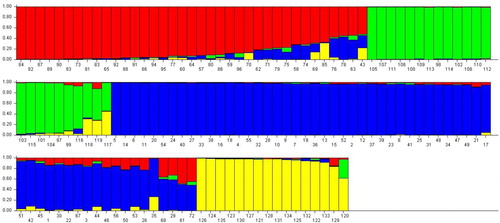
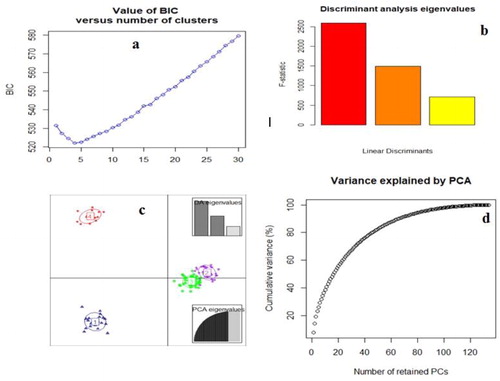
Figure 8. Bayesian information criterion (BIC)(a), the F statistic of the DAPC (b), Scatter plot from the DAPC (c) and the percentage of cumulative variance for the retained PCA eigen vectors (d) for 135 safflower accessions that were used to determine the optimal k number of clusters.