Figures & data
Figure 1. Fermentation process from the “Zaoheibao” grape fruits to wine.
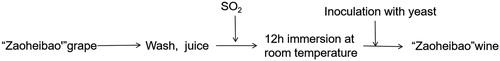
Table 1. Level table of the orthogonal test factors.
Table 2. Table of orthogonal test analysis.
Table 3. Orthogonal test results for “Zaoheibao” wine.
Figure 2. Effect of different factors on the generation of ester volatile aroma compounds during fermentation of “Zaoheibao” wine. Amount of yeast (a); SO2 amount (b); fermentation time (c). Note: A, B, C, D indicate significant differences (p < 0.01).
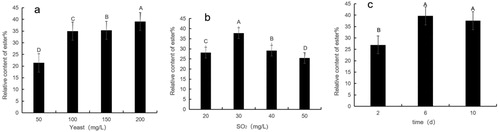
Table 4. ANOVA of the orthogonal test for “Zaoheibao” wine.
Table 5. Composition of volatile aroma substances (in %) in “Zaoheibao” wine, as determined from the orthogonal test.
Figure 3. “Zaoheibao” wine and grape juice main components. Note: Left panel, treatments (wine T1–T9; grape juice T0; see ). Right panel, aroma substances.
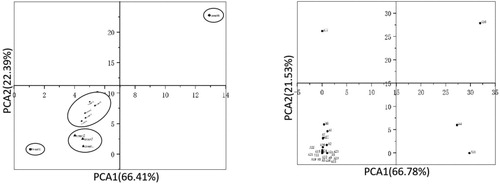
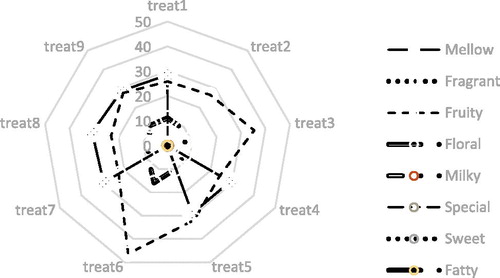
Figure 4. Aroma substance and odor contour map of “Zaoheibao” wine based on the orthogonal test. Note: Treat 1–9 represent different treatments (various amounts of SO2 and yeast starter and fermentation time; see and ).