
Figures & data
Table 1. Predicted biochemical properties of DCM dehalogenase.
Figure 1. Prediction of signal peptide and transmembrane domain of DCM dehalogenase. (a) Prediction of signal peptide of DCM dehalogenase from Methylobacterium rhodesianum H13. (b) Prediction of signal peptide of DCM dehalogenase from Hyphomicrobium sp. GJ21. (c) (i→o) Inside to outside helix; (o→i) outside to inside helix.
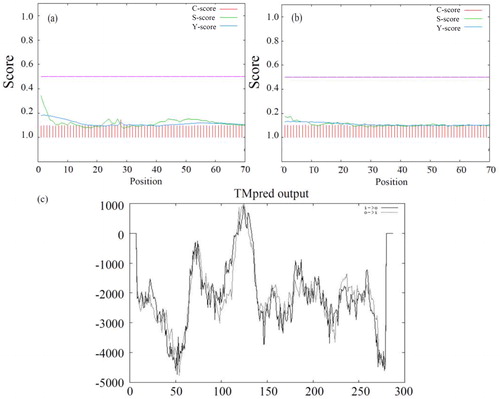
Figure 2. Detail information of DCM dehalogenase. (a) Prediction of secondary structure of DCM dehalogenase. H: helix, E: extended (sheet), blank: other (loop). (b) Prediction of phosphorylation sites of DCM dehalogenase. (c) Prediction of functional domains of DCM dehalogenase.
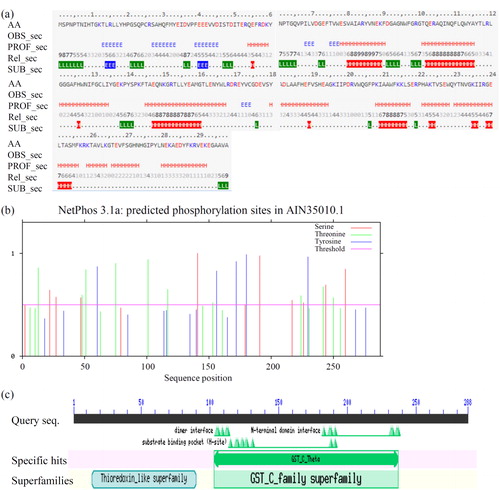
Figure 3. Phylogenetic tree analysis of DCM dehalogenase.
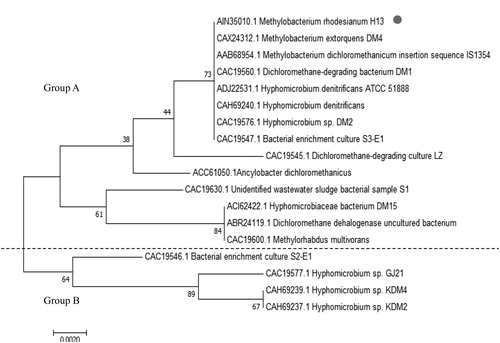
Figure 4. Multiple sequence alignment of DCM dehalogenase. Conserved residues are highlighted in different colors.
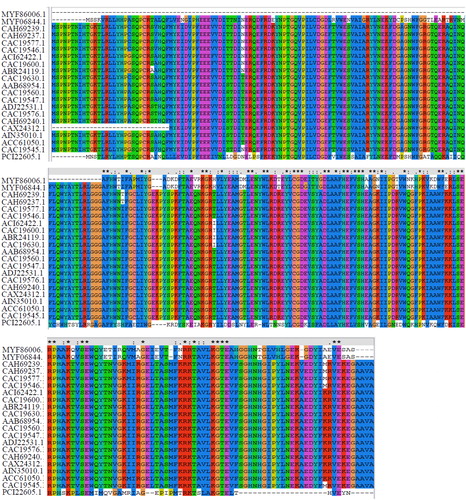
Figure 5. Model structure of DCM dehalogenase. (a) Tertiary structure of DCM dehalogenase; (b) Catalytic tunnel and the key amino acids simulation of DCM dehalogenase; (c) Molecular docking of DCM dehalogenase.
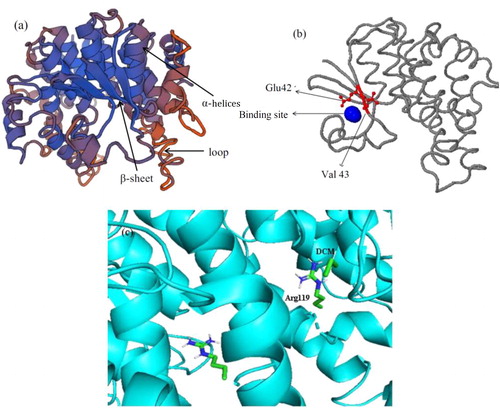
Figure 6. SDS PAGE of purified recombinant protein. (a) Lane 1: protein marker (Fermentas); lane 2: 10 mmol/L imidazole-repetition 1; lane 3: 10 mmol/L imidazole-repetition 2; lane 4: 10 mmol/L imidazole-repetition 3; lane 5: 15 mmol/L imidazole-repetition 1; lane 6: 15 mmol/L imidazole-repetition 2; lane 7: 15 mmol/L imidazole-repetition 3; lane 8: supernatant; lane 9: mixture; lane 10: marker. (b) lane 1: protein marker (…); 2: crude enzyme solution; 3: superior fluid penetration solution; 4: miscellaneous protein; 5: pure enzyme solution.
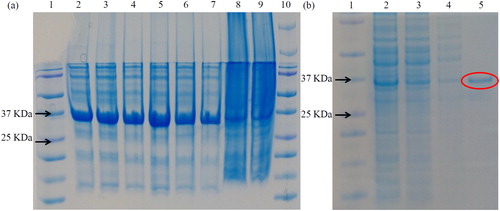
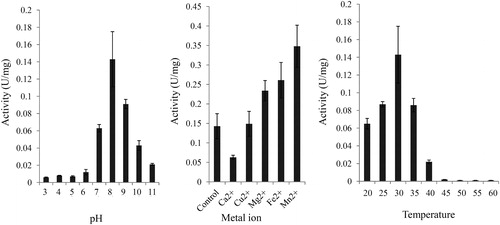
Figure 7. Analysis of enzymatic properties of DCM dehalogenase. (a) pH dependence. (b) Influence of metal ions. (c) Temperature dependence. The measurement of enzyme activity was performed after purification of DCM dehalogenase from M. rhodesianum H13. Data are mean values with standard deviation (±SD) from three independent experiments. Asterisks indicate statistically significant differences (p < 0.05).
Data availability statement
The authors confirm that the data supporting the findings of this study are available within the article.