
Figures & data
Figure 1. Effects of NXT on whole blood viscosity (WBV) in the rat blood stasis model.
Note: Data are presented as means ± SD (n = 7). **P < 0.01 compared with the normal group, #P < 0.05 compared with the model group.
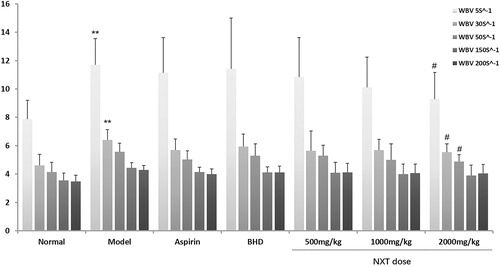
Figure 2. Effects of NXT on plasma viscosity (PV) in the rat blood stasis model.
Note: Data are presented as means ± SD (n = 7). **P < 0.01 compared with the normal group, #P < 0.05 compared with the model group.
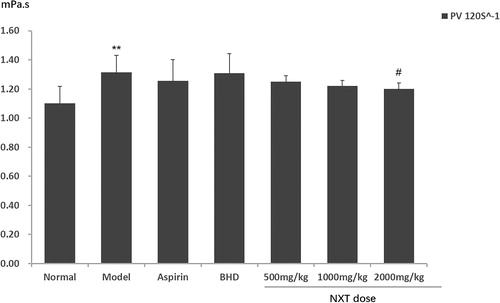
Figure 3. Effects of NXT on prothrombin time (PT), activated partial thromboplastin time (APTT) and fibrinogen (FIB) in the rat blood stasis model.
Note: Data are presented as means ± SD (n = 7). *P < 0.05, **P < 0.01 compared with the normal group, #P < 0.05, ##P < 0.01 compared with the model group.
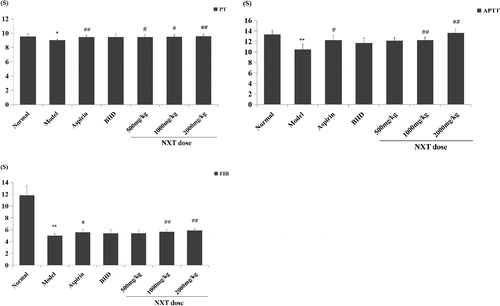
Figure 4. Effects of NXT on alanine transaminase (ALT) and aspartate transaminase (AST) in the rat blood stasis model.
Note: Data are presented as means ± SD (n = 7). **P < 0.01 compared with the normal group, #P < 0.05, ##P < 0.01 compared with the model group.
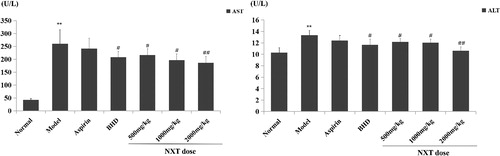
Figure 5. Effects of NXT on total antioxidant capacity (T-AOC), superoxide dismutase (SOD) and malonaldehyde (MDA) in the rat blood stasis model.
Note: Data are presented as means ± SD (n = 7). *P < 0.05, **P < 0.01 compared with the normal group, #P < 0.05, ##P < 0.01 compared with the model group.
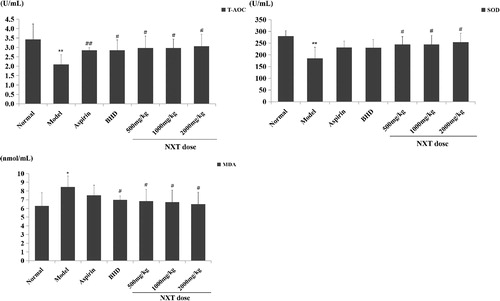
Figure 6. Effects of NXT on interleukin-1β (IL-1β) and interleukin-6 (IL-6) in the rat blood stasis model.
Note: Data are presented as means ± SD (n = 7). **P < 0.01 compared with the normal group, #P < 0.05, ##P < 0.01 compared with the model group.
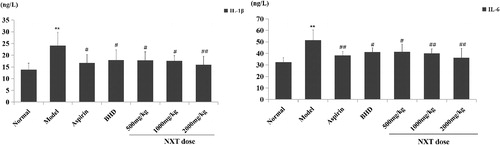
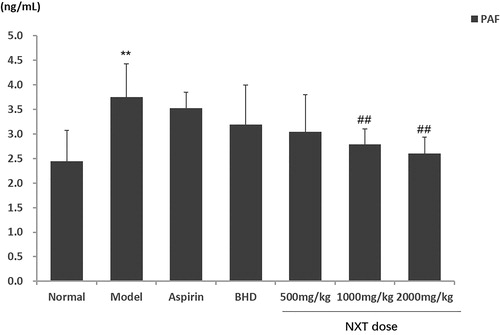
Figure 7. Effects of NXT on platelet activating factor (PAF) in the rat blood stasis model.
Note: Data are presented as means ± SD (n = 7). **P < 0.01 compared with the normal group, ##P < 0.01 compared with the model group.
Data availability statement
The data that support the findings of this study are available from the corresponding author, H.L., upon reasonable request.