Figures & data
Table 1. Summary of the chemical compounds in black and white grains.
Figure 1. KEGG enrichment analysis for differentially expressed genes between black and white quinoa grains.
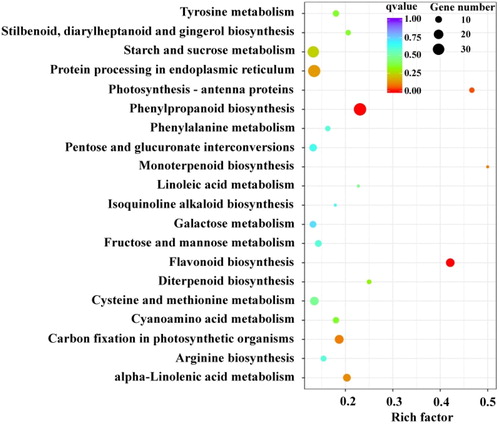
Figure 2. Expression differences between structural genes involved in flavonoids biosynthesis. The arrows show the enzyme-encoding genes and the metabolic stream. The red font indicates the differentially expressed genes encoding enzymes, and the blue font indicates the differential metabolites. The number represents the expression in the black grain relative to that in the white grain [=expression (black)/expression (white)]. The numbers under the chemical compounds represent the relative contents of the compounds accumulated in the black grain versus the white grain. These structural flavonoid biosynthesis genes and chemical compounds were more significantly upregulated in black grain than in white grain.
![Figure 2. Expression differences between structural genes involved in flavonoids biosynthesis. The arrows show the enzyme-encoding genes and the metabolic stream. The red font indicates the differentially expressed genes encoding enzymes, and the blue font indicates the differential metabolites. The number represents the expression in the black grain relative to that in the white grain [=expression (black)/expression (white)]. The numbers under the chemical compounds represent the relative contents of the compounds accumulated in the black grain versus the white grain. These structural flavonoid biosynthesis genes and chemical compounds were more significantly upregulated in black grain than in white grain.](/cms/asset/df6fb710-0247-4301-8f5b-8b914acb9518/tbeq_a_1822207_f0002_c.jpg)
Figure 3. Expression differences of unigenes involved in betalain biosynthesis. The arrows show the enzyme-encoding genes and the metabolic stream. The red font indicates the differentially expressed genes encoding enzymes, and the blue font indicates the differential metabolites. The numbers represent the expression in the black grain relative to that in the white grain (log2FC). The numbers under the chemical compounds represent the relative contents of the compounds accumulated in the black grain versus the white grain.
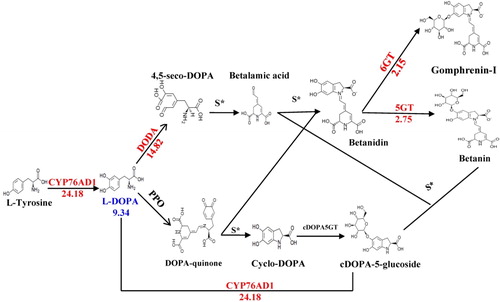
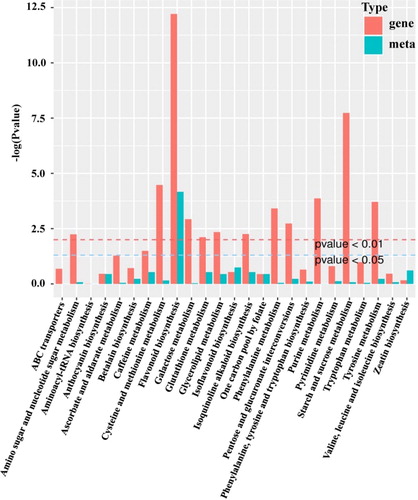
Figure 4. Kyoto Encyclopedia of Genes and Genomes (KEGG) enrichment histogram of conjoint analysis of differentially expressed genes and accumulated metabolites. The X-axis represents the metabolic pathways; the Y-axis represents the expression as –log (p value). The red columns represent the enrichment p values of differentially expressed genes, and the green columns represent the enrichment p values of different metabolites.