Figures & data
Figure 1. Developmental stages of Hyssopus officinalis L. single flowers.
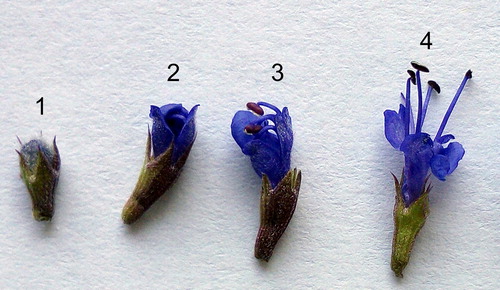
Table 1. Nucleotide sequences of forward and reverse primers used for PCR amplification of SRAP markers.
Figure 2. Distribution of data for Nei’s gene diversity index (a) and Shannon’s index (b) among plants from the two analysed populations, Godech and Izvor.
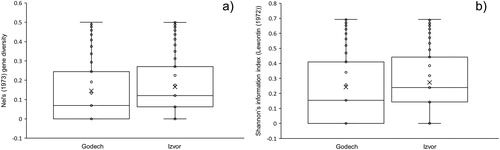
Table 2. Average gene diversity (GD)/polymorphic information content (PIC) for each SRAP marker/primer pair as well as range of variation per the average gene diversity for all SRAP markers.
Table 3. Genetic variation within the two analysed populations.
Figure 3. Principal Coordinates Analysis (PCoA) (a) and UPGMA clustering of Jaccard indices (b) of samples from the two analysed populations. Blue diamonds indicate samples from population Godech; red squares indicate samples from population Izvor. Ellipses and semicircles marked with 1 and 2 indicate clusters of samples belonging to population Godech and Izvor, respectively.
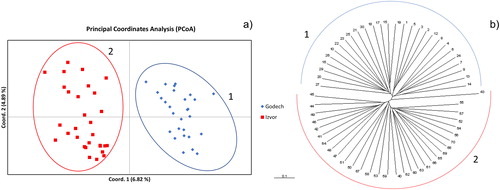
Figure 4. Genetic structure of two Hyssopus officinalis L. populations based on SRAP marker data. (a) Estimation of the most probable K using the delta K method by Evano et al. [Citation19]. (b) Bar plot representing the genetic structure at K = 2 for populations Godech and Izvor.
![Figure 4. Genetic structure of two Hyssopus officinalis L. populations based on SRAP marker data. (a) Estimation of the most probable K using the delta K method by Evano et al. [Citation19]. (b) Bar plot representing the genetic structure at K = 2 for populations Godech and Izvor.](/cms/asset/32875f06-2d5b-4468-bb6d-3d9d1ea39763/tbeq_a_1835537_f0004_c.jpg)
Table 4. Genetic differentiation between the two analysed populations.
Table 5. Summary AMOVA table based on analysis of two natural H. officinalis populations in Bulgaria.
Table 6. Mean percentage and range of variation for all identified compounds in the two analysed populations and the two identified metabolite clusters as seen in . Compounds shown in bold are part of ISO 9841:2007[23].
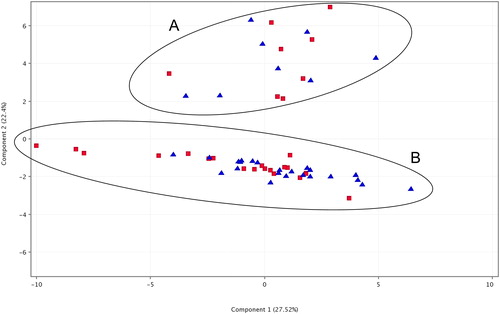
Figure 5. Principal Component Analysis (PCA) of samples from the two analysed populations based on GC/MS data for compound abundances. Red squares indicate samples from population Godech; blue triangles indicate samples from population Izvor. The two ellipses marked with A and B indicate the observed two clusters corresponding to the two different chemotypes.