
Figures & data
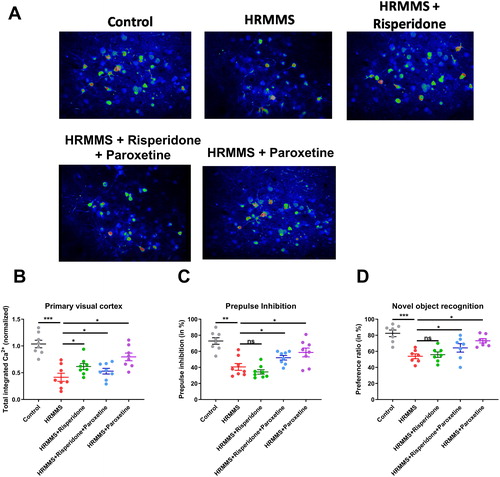
Figure 1. Neuronal activity in visual cortex and behavioural phenotyping. (A) Representative pseudo-coloured images showing the calcium activity in the visual cortex. (B) Quantification of total integrated calcium activities in the primary visual cortex. (C) Prepulse inhibition (in %) from different treatment groups. (D) Novel object recognition ratios of all animals. Note: ns, non-significant (p > 0.05); *p < 0.05, **p < 0.01, ***p < 0.001.
Data availability statement
The datasets generated and analysed during the present study are available from the corresponding author on reasonable request.