Figures & data
Table 1. Basic information of CDPK genes identified in Citrus sinensis.
Figure 1. Chromosomal distribution of the CsCDPK genes (A) and synteny analysis of the CDPKs in Arabidopsis thaliana and Citrus sinensis (B). Note: In (A), chromosome numbers are provided at the top of each chromosome with the approximate size. The CsCDPKs were named CsCDPK1 to CsCDPK29 based on their order on the chromosomes. Red lines indicate the gene clusters with tandem duplications. In (B), grey lines in the background indicate the collinear blocks within the citrus and Arabidopsis genomes, while the blue lines highlight the syntenic CsCDPK gene pairs.
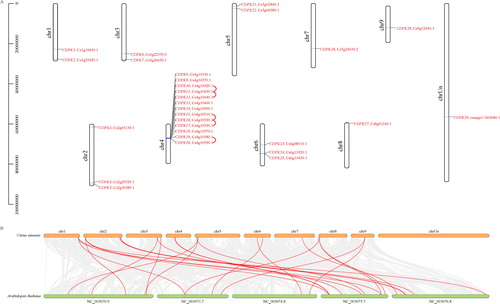
Figure 2. Phylogenetic tree of the CsCDPKs based on an alignment of the citrus and Arabidopsis proteins. Note: The phylogenetic tree was constructed via the neighbour-joining method in MEGA 7.0. Reliability of the predicted tree was tested by bootstrapping with 1000 replicates. Branch lines with different colours represent different CsCDPK groups.
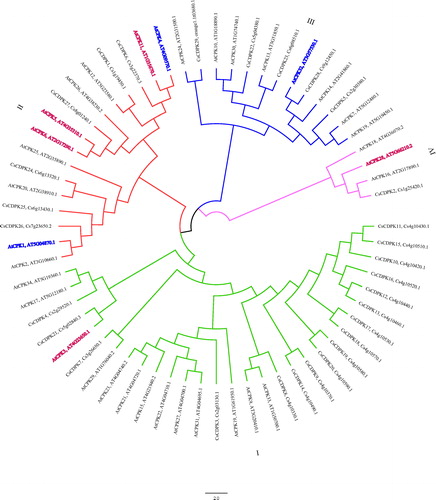
Figure 3. Phylogenetic tree of the deduced CsCDPK proteins associated with the motif and exon–intron compositions of the CsCDPK genes. Note: The phylogenetic trees were constructed via the neighbour-joining method in MEGA 7.0 (left side of the figure). Reliability of the predicted tree was tested by bootstrapping with 1000 replicates. The motif composition related to each CsCDPK protein is displayed in the middle of the figure. The motifs (1–10) are displayed in different coloured boxes, and motif information is provided in . The exon–intron structure of the CsCDPK genes and EF-hand and Pkinase domains are displayed on the right side of the figure. Green boxes indicate untranslated 5′- and 3′-regions, yellow boxes indicate the coding sequence (CDS), and black lines indicate introns. The domains are highlighted by purple or pink boxes, respectively. The length of the protein can be estimated with the scale at the bottom.
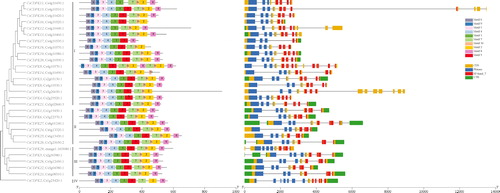
Figure 4. Expression profiles of the CsCDPK genes responding to AMF colonization and/or drought stress. Note: The colour scale represents the log2 expression values; the red and blue colours indicate high or low transcript abundances compared to the relevant control (non-AMF plants under the well-watered condition), respectively.
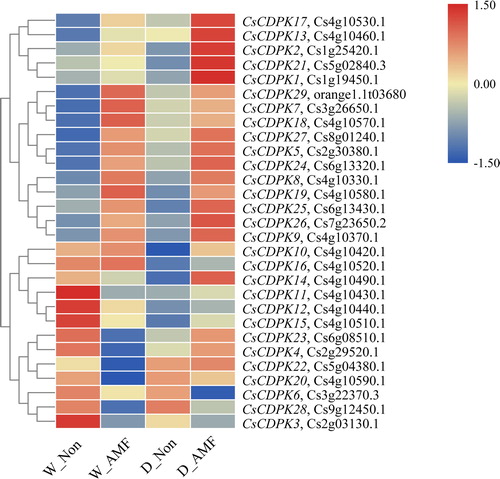
Figure 5. CsCDPK expression with AMF colonization and/or drought stress treatment by qRT-PCR. Note: The relative gene expression was calculated using the 2−△△Ct method, with β-actin as the reference gene. Significant differences between treatments were determined by Duncan’s Multiple Range Tests at p = 0.05. Different letters indicate significant differences.
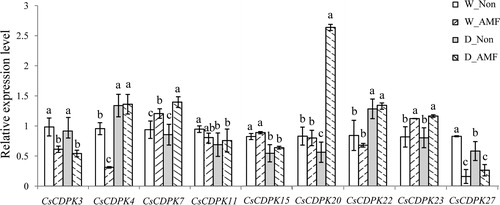
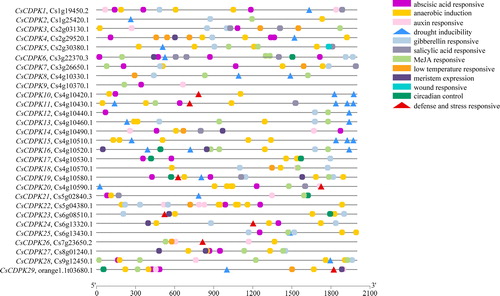
Figure 6. Predicted cis-elements in the promoters of the CsCDPKs. Note: The ‘defence- and stress-responsive’ and ‘drought inducibility’ cis-elements are indicated by red and blue triangles, respectively.