
Figures & data
Figure 1. MCC values for different sizes of sliding window on ATP-168 and ATP-227.
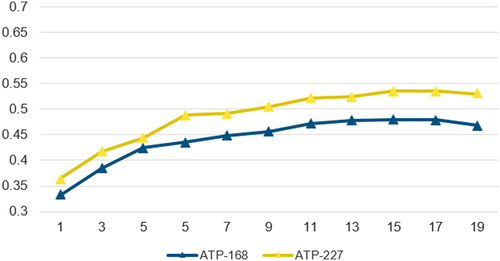
Figure 2. Architecture of the proposed method.
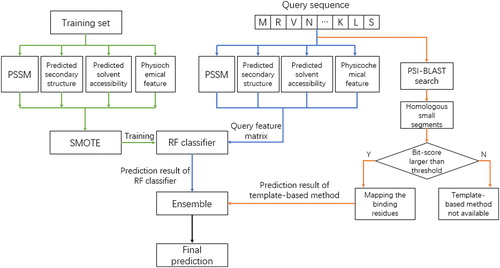
Figure 3. Framework of the proposed prediction procedure.
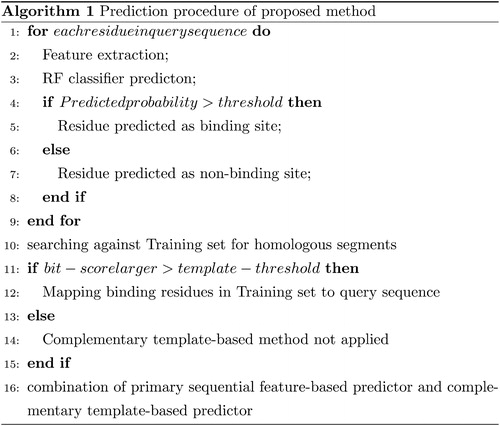
Table 1. Prediction performance based on the under-sampled dataset, original dataset and SMOTE dataset over five-fold cross-validation.
Figure 4. Prediction ROC curves of datasets with SMOTE algorithm, original datasets without under-sampling and datasets with under-sampling on ATP-168 (a) and ATP-227 (b).
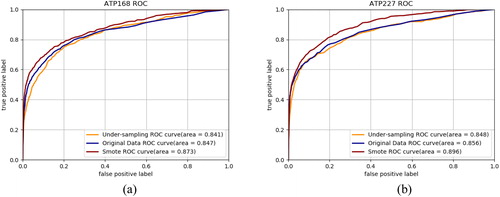
Table 2. Comparison of prediction performance with and without the template-based method on ATP-168 and ATP-227 over five-fold cross-validation.
Figure 5. ROC curves of prediction result with and without template-based method on ATP-168 (a) and ATP-227 (b).
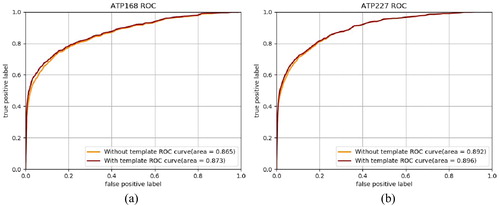
Table 3. Performance comparison of our proposed method with ATPint on ATP168 over five-fold cross-validation.
Table 4. Prediction results comparison of our proposed method with other sequence-based methods on ATP-227 over five-fold cross-validation.
Table 5. Performance comparison of our proposed method with other sequence-based methods on an independent testing set.
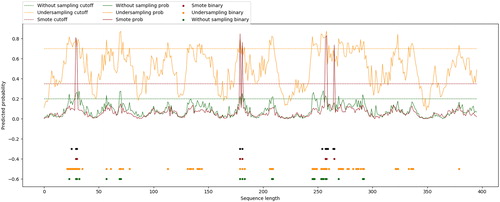
Figure 6. Binding sites predicted by the proposed method, predictor constructed on under-sampled dataset, predictor constructed on original dataset and TargetATP for protein 1O93_A.
Note: Black dots indicate the true binding sites in the protein sequence; blue dots indicate the binding residues predicted by the proposed method; red, orange and green dots represent the result of TargetATP, predictor constructed on under-sampled dataset and predictor constructed on original dataset, respectively. The probability curves of involved predictors are drawn in corresponding colors.
Data availability statement
The data that support the findings of this study are openly available in BMC Bioinformatics at https://doi.org/10.1186/1471-2105-10-434, reference [Citation17], and in Proteome Science at https://doi.org/10.1186/1477-5956-9-s1-s4 [Citation18].