Figures & data
Table 1. Biotechnological applications of β-mannanase.
Figure 1. Phylogenetic affiliation of Streptomyces sp. Alg-S25 based on 16S rRNA gene sequences. The numbers at the nodes indicate the bootstrap percentage values of 1000 iterations. GenBank accession numbers are specified in the parentheses. Scale indicates 0.002 substitutions per nucleotide position.
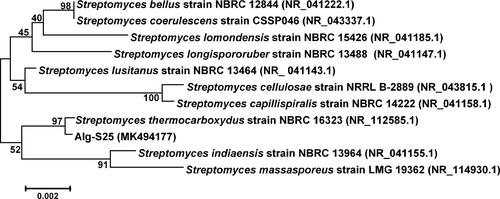
Figure 2. FTIR spectra of glutaraldehyde-activated chitosan nanoparticles (a) and chitosan nanoparticle-immobilized β-mannanase (b).
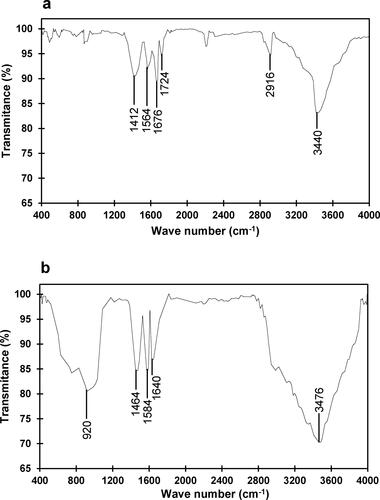
Figure 3. Influence of pH on free and immobilized β-mannanase activity. Analyses were conducted three times and data are reported as mean values ± SD.
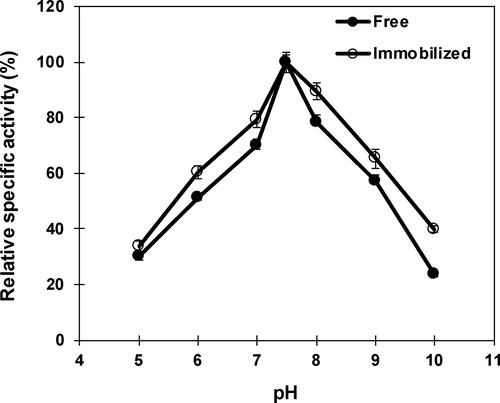
Figure 4. Influence of pH on free and immobilized β-mannanase stability. Analyses were conducted three times and data are reported as mean values ± SD.
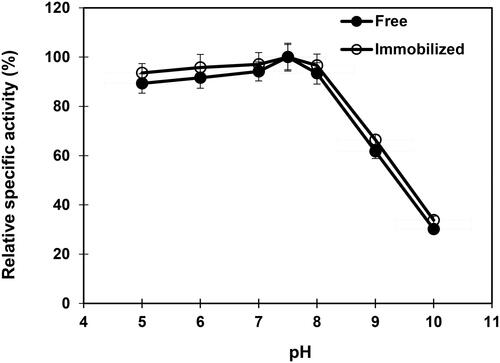
Figure 5. Influence of temperature on free and immobilized β-mannanase activity. Analyses were conducted three times and data is reported as mean values. Standard deviations are less than 5% of mean values. Error bars are not displayed for the clarity.
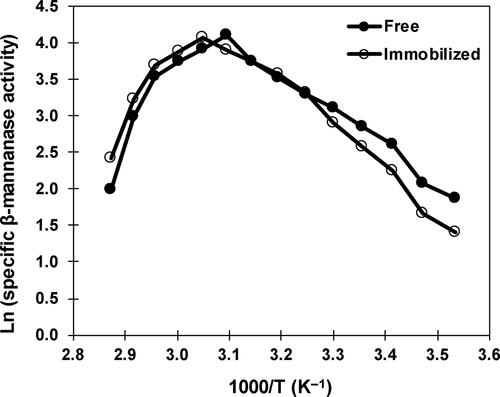
Figure 6. Influence of temperature on free and immobilized β-mannanase stability. Analyses were conducted three times and data are reported as mean values ± SD.
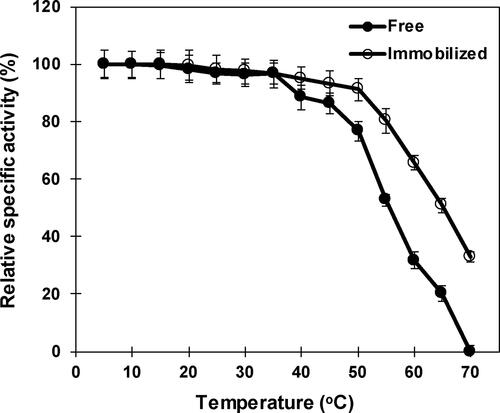
Figure 7. Effect of sodium chloride on free and immobilized β-mannanase activity. Analyses were conducted three times and data are reported as mean values ± SD.
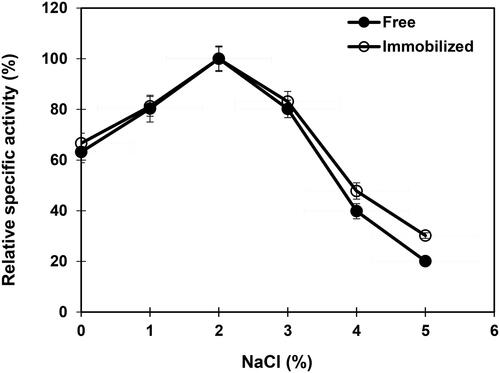
Table 2. Influence of metal ions and inhibitors on free and nanoparticle-immobilized β-mannanase activity.
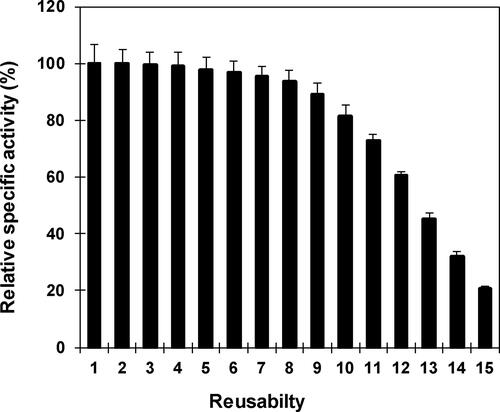
Figure 8. Repetitive application of nanoparticle immobilized β-mannanase. Analyses were conducted three times and the values of residual specific activity are reported as mean values ± SD.