
Figures & data
Figure 1. Summary of the mutation information with statistical analysis. (A, B, C) Classification of mutation types based on different categories. (D, E) Tumor mutation number in specific samples. (F) The top 10 mutated genes in bladder cancer (BLCA). SNP, single nucleotide polymorphism; SNV, single nucleotide variants.
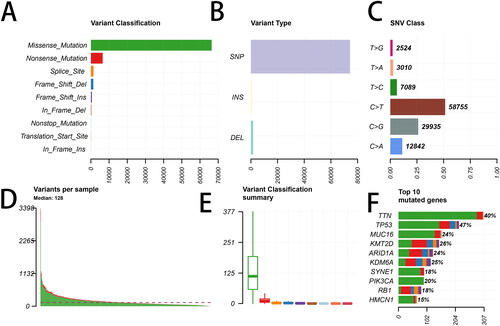
Figure 2. Landscape of mutation profiles in bladder cancer (BLCA) samples. A total of 34 genes with more than 10% of mutation frequency were chosen in the waterfall plot. Various colors of the waterfall plot with annotations at the bottom represent different mutation types. The barplot above the legend shows the mutation number.
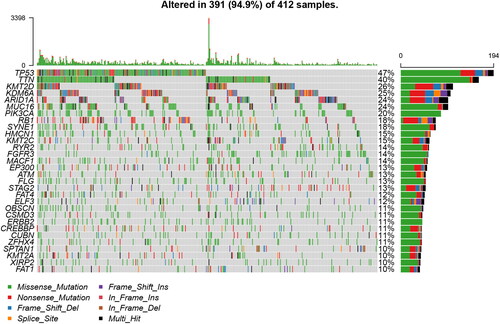
Figure 3. Differentially expressed genes analysis. A total of 3180 differentially expressed genes (DEGs) between BLCA and normal bladder tissues, including 579 up-regulated DEGs and 2601 down-regulated DEGs, were listed in (A) a heat map and (B) a volcano map.
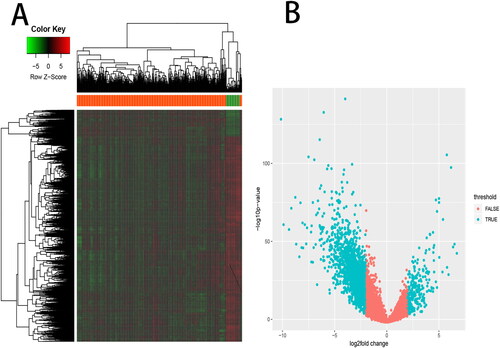
Figure 4. Overlapping of differentially expressed genes (DEGs) with mutated genes. (A) Venn diagram represents the overlapping genes between DEGs and genes with more than 5% of mutation frequency. (B) The expression of the overlapping genes was shown in a heat map.
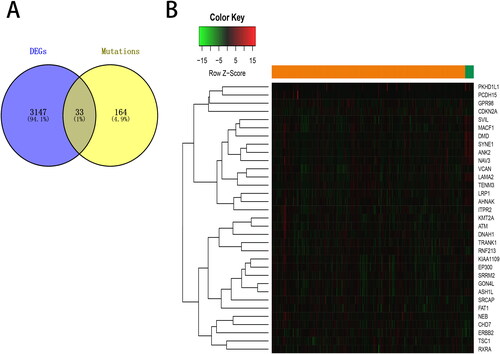
Figure 5. Functional enrichment analysis. The top 10 items of the KEGG pathway and GO enrichment analyses are shown in the form of a bubble plot using the clusterProfiler package. p < 0.05 was considered statistically significant. (A) KEGG; (B) BP, biological process; (C) CC, cellular components; (D) MF, molecular function. GO, Gene Ontology; KEGG, Kyoto Encyclopedia of Genes and Genomes.
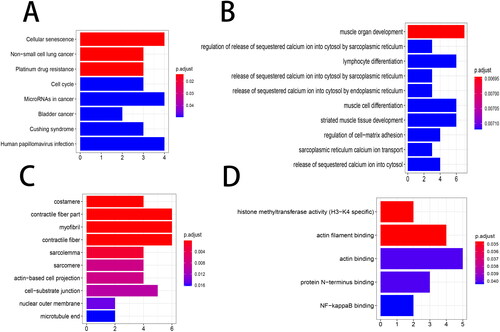
Figure 6. PPI network construction and module analysis. (A) PPI network of the overlapping genes was constructed by the STRING (Search Tool for the Retrieval of Interacting Genes) online tool. (B) The significant gene module was visualized by the MCODE (Molecular Complex Detection, Version 1.4.2) plug-in of Cytoscape software. The circle node represents the down-regulated genes and the diamond node represents the up-regulated genes. The size of node is positively correlated with the degree value and the color depth is positively correlated with Mutation percent.
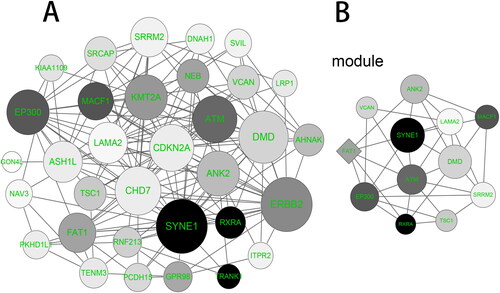
Table 1. Hub genes in the PPI network module.
Figure 7. Hub gene expression and survival analysis. The expression of (A) SYNE1, (B) DMD, (C) ANK2 and (D) LAMA2 as well as (E) the survival analysis of LAMA2 were analyzed by the GEPIA website. Red boxplot represents BLCA tumor tissues and gray boxplot represents normal tissues.
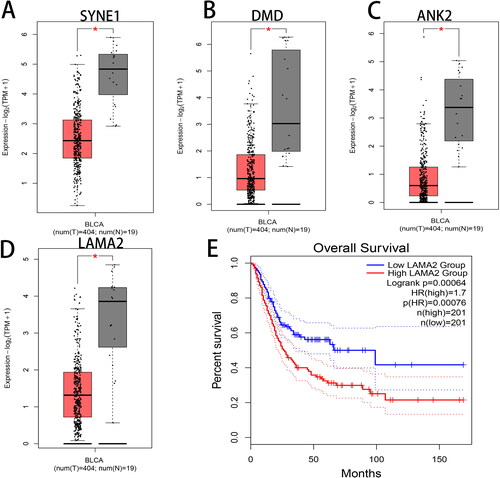
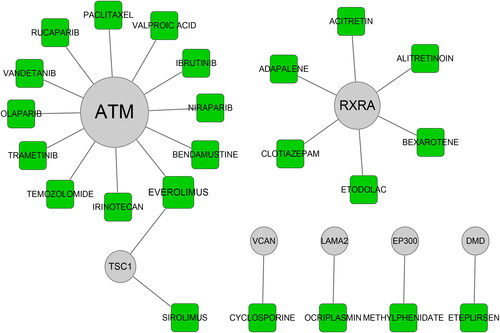
Figure 8. Drug–gene interaction. The potential targeting relationship between candidate drugs and hub genes.
Supplemental Material
Download MS Word (115.6 KB)Data availability statement
The data support the findings of this study are available on reasonable request from the corresponding author.