
Figures & data
Figure 1. Molecular structures of Indole Imine(s) A: Compound 389; N-(4-Methoxyphenyl) (4,6-dimethoxy-2,3-diphenyl-1H-indol-7-yl) methanimine, B: Compound 393; N-(4-Bromophenyl) (4,6-dimethoxy-2,3- diphenyl-1H-indol-7-yl) methanimine.
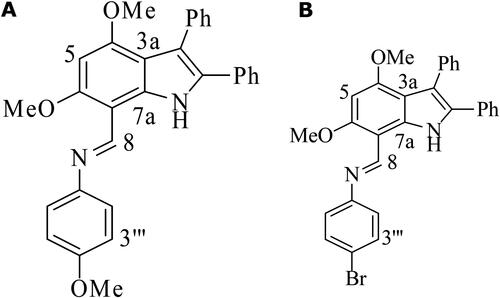
Table 1. Effects of test compounds on acid output, gastric mucosal injury and mucus contents in ethanol-induced ulcer in rats.
Figure 2. Effect of test compounds on gastric juice parameters including pH and acid volume (mL) in ethanol-induced ulcer in rats.
Note: Values are expressed as Mean ± SEM (n = 5); asterisks indicate significant differences ***p < 0.001; **p < 0.01; *p < 0.05; ns, non-significant vs. control group.
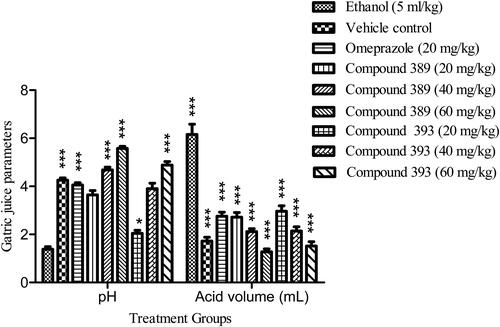
Figure 3. Effect of test compounds on ulcer severity in ethanol-induced ulcer in rats.
Note: Values are expressed as Mean ± SEM (n = 5); asterisks indicate significant differences ***p < 0.001; **p < 0.01; *p < 0.05; ns, non-significant vs. control group.
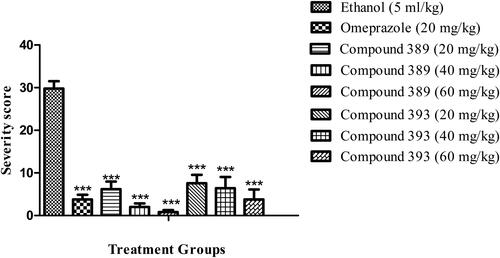
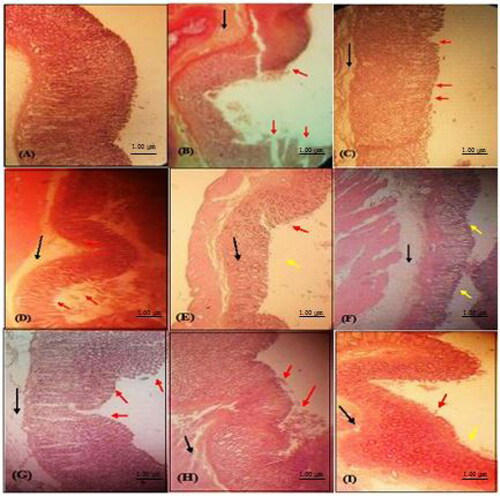
Figure 4. Histological examination of rat stomach (H & E stained) from different treatment groups: (A) Normal vehicle control group; (B) Ulcer control (ethanol 5 mL/kg) showing mucosal damage; (C) Standard drug (omeprazole treated; 20 mg/kg bw); (D) Compound 389 treated (20 mg/kg bw); (E) Compound 389 (40 mg/kg bw); (F) Compound 389 (60 mg/kg bw) showing normalization of morphological changes; (G) Compound 393 (20 mg/kg bw); (H) Compound 393 (40 mg/kg bw); (I) Compound 393 (60 mg/kg bw) showing normalization of morphological changes. Red arrow (disrupted epithelium), black arrow (oedema and neutrophil infiltration), yellow arrow (intact epithelium).
Data availability
All data that support this study are available from the corresponding authors [AM and MR] upon reasonable request.