
Figures & data
Figure 1. Effects of Naringi crenulata extract on SK-BR3 cells in vitro. (a) Cell viability and cell morphology (b) following treatment with water, ethanol and hexane extracts compared with the control (nontreated). Images were captured with a 40x objective on an inverted light microscope. Note. (a) The cell viability in the nontreated control was taken as 100%. (b) The cell viability was varied thereby cells lost their adhesion property. Scale bars correspond to 50 μm.
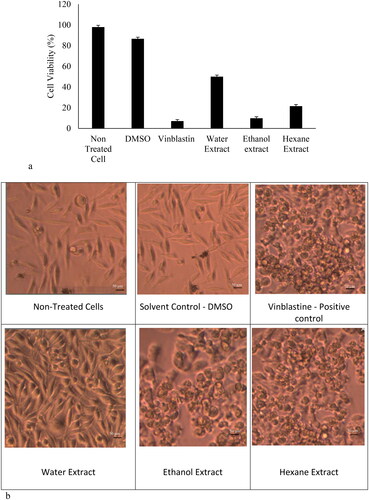
Figure 2. Effects of Hexane: Ethanol ratio for extraction of the cytotoxic compound(s) from the leaves of Naringi crenulata. Note. The cell viability in the nontreated control was taken as 100%.
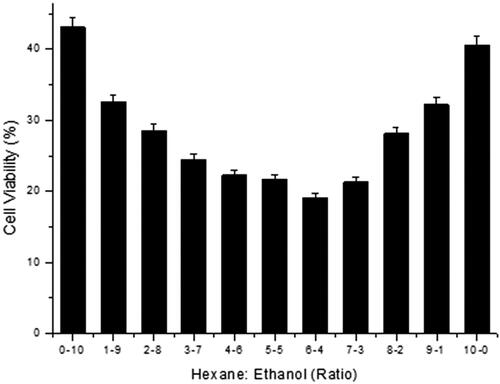
Figure 3. Cell viability following treatment with compounds in different fractions collected from the column fractionation process. Note. The cell viability in the nontreated control was taken as 100%.
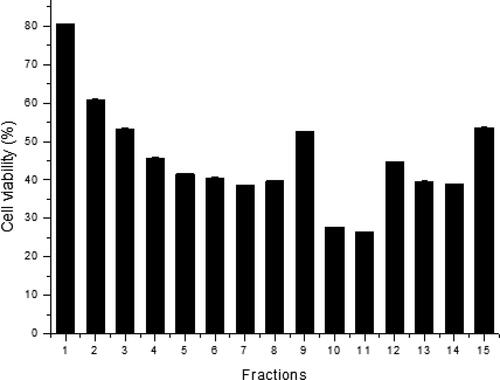
Figure 4. Identified phytocompounds in Naringi crenulata extract. GC–MS analysis (a) and chemical structures (b) of phytocompounds present in the higher activity of fraction 11 obtained from column fractionation. Note. Compound codes are listed in . The solvent ratio of 6:4 (hexane: ethanol) was used to obtain the extract analyzed subsequently.
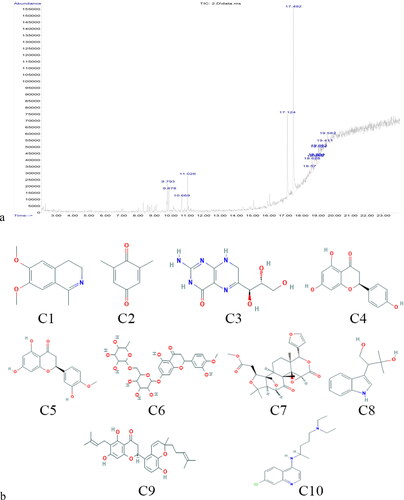
Table 1. Phytochemicals identified from the extract of Naringi crenulata by GC–MS.
Figure 5. SK-BR3 cells kept for incubation at different concentrations of NCE (hexane to ethanol ratio of 6:4) for about 24 h and observed under an inverted light microscope. Note. Images were captured with a 40× objective on an inverted light microscope. Scale bars correspond to 50 μm.
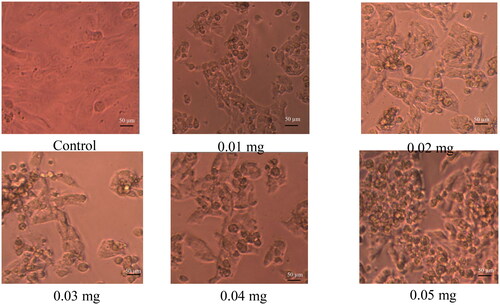
Figure 6. Effects of NCE on cell cycle distribution. Representative results (a) and histograms (b). SK-BR3 human breast cancer cells were treated with 24.5 μmol/L NCE for 24 h and then harvested and stained with PI, and analyzed using flow cytometry.
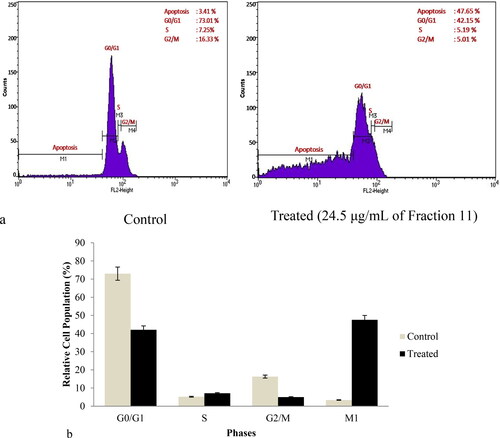
Figure 7. JC-1 green fluorescence ratio signals in SK-BR3 cells with and without treatment with Fraction 11. Note: SK-BR3 human breast cancer cells were treated with 24.5 μmol/L of Fraction 11 for 24 h. Images were captured with a 40× objective on an inverted imaging system.
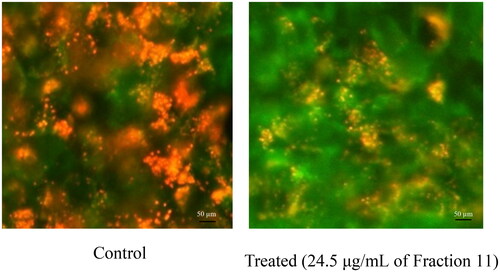
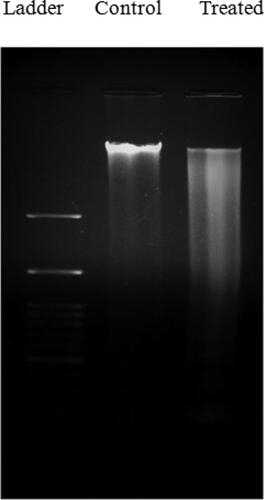
Figure 8. DNA fragmentation in SK-BR3 cells after treatment with NCE. The cells are treated with the NCE at IC50 for 24 h. Lane 1: untreated SK-BR3 cells; Lane 2: SK-BR3 cells treated with 24.5 μg/mL.
Data availability statement
The data that support this study are available from the corresponding author upon reasonable request.