
Figures & data
Table 1. Alpha diversity parameters of the three groups of GJ, GNT and GCT.
Figure 1. UPGMA phylogenetic tree based on weighted unifrac distance combined with phylum-level species distribution.
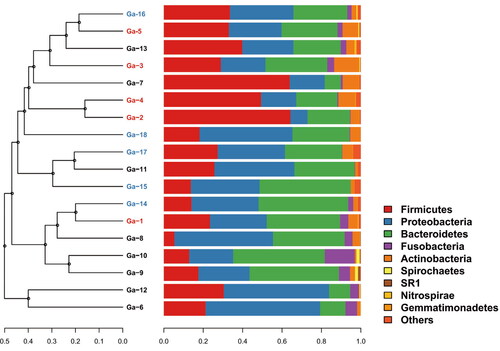
Table 2. Microbial distribution of the three groups of GJ, GNT and GCT.
Table 3. Distribution of the top 20 most dominant OTUs in the 18 samples and their closest cultured bacteria.
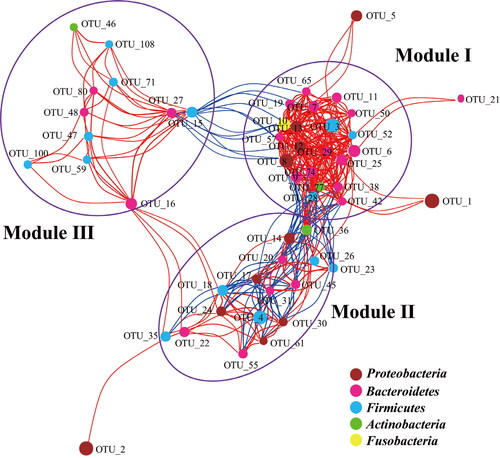
Figure 2. Network of co-occurring OTUs based on correlation analysis.
Note: The selection standards for strong and significant correlation are Spearman’s r > 0.6 and p < 0.05, respectively. The size of each node is proportional to the relative abundance; the colour and thickness of each connection between two nodes (edge) is proportional to the value of Spearman’s correlation coefficients. Blue lines show negative correlation between two nodes; red lines show positive correlation between two nodes.
Supplemental Material
Download PDF (441.3 KB)Data availability statement
The data that support the findings of this study are available from the corresponding author upon reasonable request.