
Figures & data
Table 1. Extraction method, library construction and sequencing information.
Figure 1. Separation of DNase treated total RNA using the Phenol based method (Lanes 2-7 both control and treated samples) and RNeasy kit (Lanes 8-13, both control and treated samples), on 1% formaldehyde (w/v) denaturing 1.2% agarose gel electrophoresis showing multiple ribosomal RNA bands with no signs of RNA degradation. [M, 100 bp DNA Ladder].
![Figure 1. Separation of DNase treated total RNA using the Phenol based method (Lanes 2-7 both control and treated samples) and RNeasy kit (Lanes 8-13, both control and treated samples), on 1% formaldehyde (w/v) denaturing 1.2% agarose gel electrophoresis showing multiple ribosomal RNA bands with no signs of RNA degradation. [M, 100 bp DNA Ladder].](/cms/asset/edbb2ce0-42f9-4a3a-9c51-1b298f4650d6/tbeq_a_1910567_f0001_c.jpg)
Table 2. Purity or integrity and average yields of total RNA extracted by the two methods and determined spectrophotometrically (nanodrop vs Bioanalyzer vs Tapestation).
Figure 2. (a) "Gel Image" display of microcapillary electrophoresis electropherograms demonstrating the integrity of the RNA in the Agilent 2100 Bioanalyzer. The lower marker band across all samples is the electrophoresis marker (roughly 22 s). Phenol based method (Lanes 2-7, both control and treated samples) and RNeasy kit (Lanes 8-13 both control and treated samples); (b) injected ladder in RNA 6000 Nano total RNA kit.
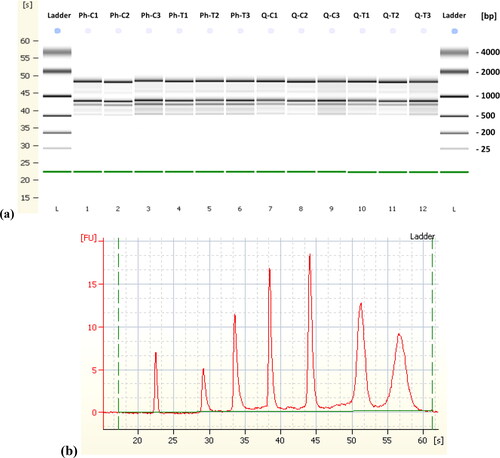
Figure 3. Electropherogram of the RNA of the three biological replicates of the control samples (Qiagen RNeasy Kit) using 2100 Bioanalyzer RIN: 6.4.
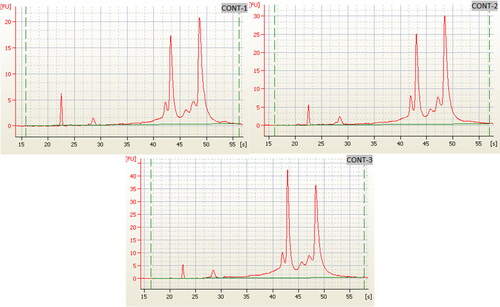
Table 3. Plant ribosomal RNA.
Figure 4. Electropherogram of post-library construction check from the Agilent 2200 TapeStation system for RNeasy extracted sample (Q-C1).
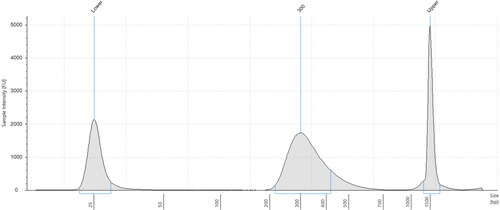
Table 4. mRNA-seq Library quality check Result - Agilent 2200 TapeStation.
Table 5. Basic statistics of the retrieved raw data.
Figure 5. Quality score across all bases [RNeasy extracted sample (Q-C1)] - dataset ready for assembly - Forward R1 (a) and Reverse R2 (b).
![Figure 5. Quality score across all bases [RNeasy extracted sample (Q-C1)] - dataset ready for assembly - Forward R1 (a) and Reverse R2 (b).](/cms/asset/0b79526f-f8b6-469d-91a8-8853877a0f21/tbeq_a_1910567_f0005_c.jpg)
Table 6. RNA-seq Paired-end data quality and adapter trimming using Trimmomatic.
Table 7. De-novo transcriptome assembly, general statistics.
Data availability
The authors confirm that the data supporting the findings of this study are available within the article.