
Figures & data
Table 1. Analyzed gene expressions.
Figure 1. Inhibition of C6 glioma cell viability across different concentrations of AT7867 and time periods. GraphPad Prism 6 was used to analyze the inhibition of cell viability and statistical analysis was performed using Student’s t-test among treated and untreated cells. Boldface values of a, b, c show statistical significance at p < 0.05.
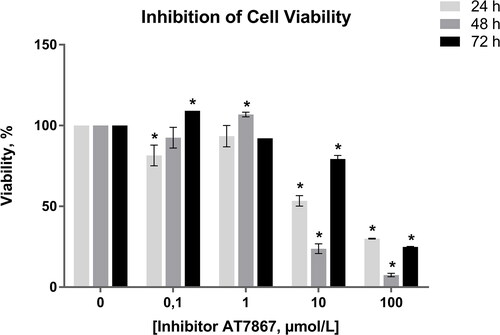
Figure 2. Inhibition of C6 glioma cell viability across different concentrations of calcitriol for 24 h. GraphPad Prism 6 was used to analyze the inhibition of cell viability, and statistical analysis was performed using Student’s t-test among treated and untreated cells. Boldface values of * show statistical significance at p < 0.05.
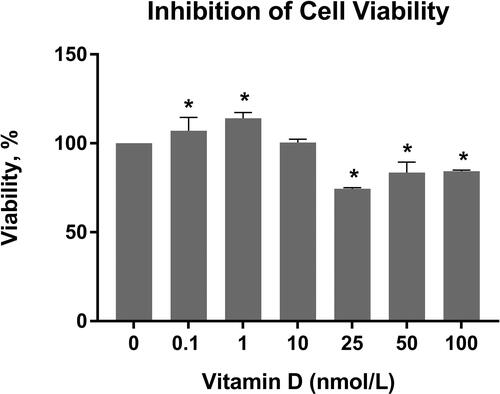
Figure 3. Combined effects of 100 nmol/L calcitriol (vitamin D) and the 0.1, 1, 10 and 100 dose interval of AT7867 (inhibitor) for 24 h. GraphPad Prism 6 was used to analyze the inhibition of cell viability and statistical analysis was performed using Student’s t-test among treated and untreated cells, p values were shown in . The significances among groups were analyzed by one-way ANOVA test and boldface values of a, b and c show statistical significance at p < 0.05 by Tukey’s post-hoc test, a is between calcitriol and inhibitor, b is between calcitriol and combined dose and c is between inhibitor and combined dose.
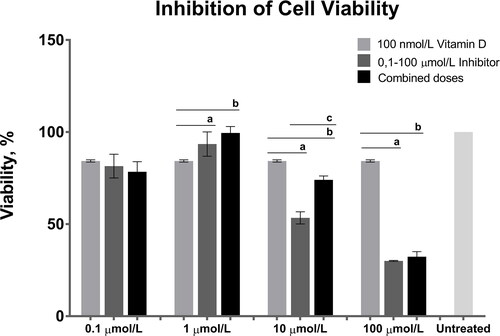
Table 2. MTT results of different individual and combined doses of Vitamin D and AT7867 at 24 h.
Figure 4. Relative expression levels expressed as Log22(−ΔΔCt) of related genes across 100 nmol/L calcitriol (vitamin D), 10 µmol/L AT7867 (inhibitor), and for both calcitriol and AT7867 for 24 h. Positive log2 fold change (FC) of expressions show the upregulated genes, and negative of those show downregulation of genes.
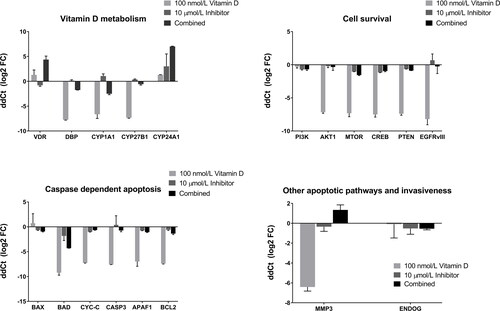
Table 3. Relative fold changes and p values of gene expressions.
Data availability
All data that support the findings reported in this paper are available from the corresponding author upon reasonable request.