
Figures & data
Figure 1. Genome circle map (A) and COG function annotation (B) of B. velezensis BA-26. (A) The circle map shows seven kinds of information from the outside to the inside: circle 1 is genome location information, circle 2 is GC content information, circle 3 is coding gene on positive chain (red label), circle 4 is coding gene on negative chain (green label), circle 5 is ncRNA information on the positive chain (blue mark), circle 6 is ncRNA information on the negative chain (purple label), and circle 7 marks the information of long fragment repeats (≥ 100 bp) in the genome (orange tagging). (B) Functional classification of COG genes of strain BA-26.
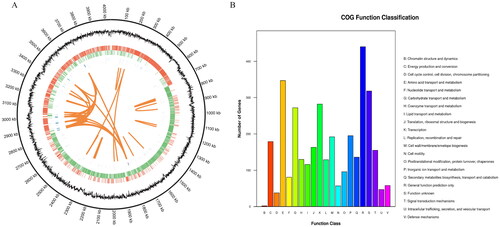
Table 1. Genomic characteristics of B. velezensis BA-26.
Figure 2. Functional annotation of secondary metabolite-related genes in B. velezensis BA-26 using KEGG metabolic pathway analysis.
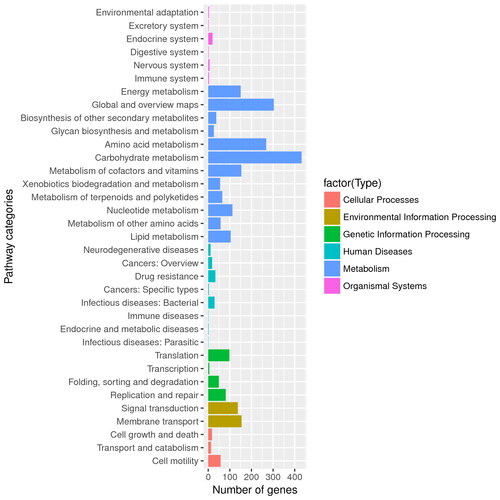
Figure 3. GO functional classification of B. velezensis BA-26 genes.
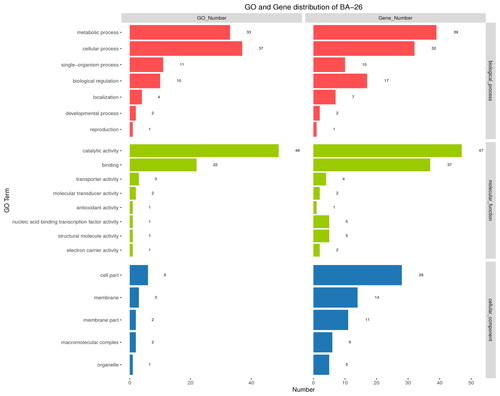
Figure 4. Gene distribution of CAZy family in the B. velezensis BA-26 genome.
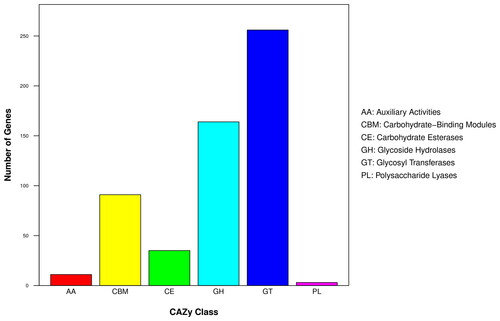
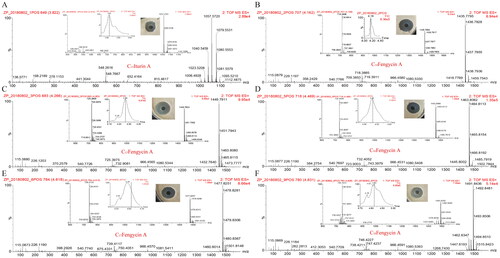
Figure 5. LC-MS/MS analysis of iturin and fengycin A. C15 iturin A (A) and fengycin A (B–F) series compounds were identified by mass spectrometry and both showed strong antifungal activity against B. cinerea.
Supplemental Material
Download PDF (1.9 MB)Data availability
All data that support the findings from this study are available from the corresponding author (…) upon reasonable request.