
Figures & data
Figure 1. Sequence analysis of SbPMK and its promoter region. (A) Exon and intron sites of SbPMK. (B) Phylogenetic analysis of PMK from S. baumii and other species. (C) Functional elements of the SbPMK promoter.
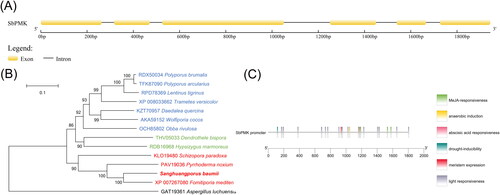
Figure 2. Analysis of the secondary structure and predicted three-dimensional structure of SbPMK. (A) Annotation of the secondary structure of SbPMK. (B) Predicted three-dimensional structure of SbPMK. (C) Hydrophobicity analysis of SbPMK.
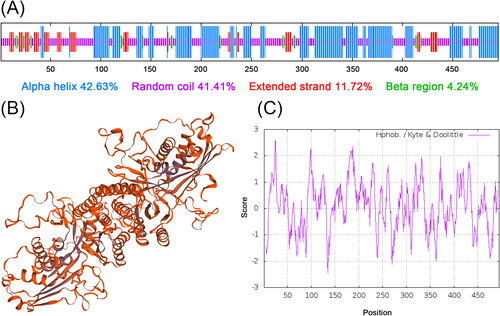
Table 1. List of primers used in the study.
Table 2. Origins of homologous amino-acid sequences from other species.
Figure 3. Sequence alignment of the 14 amino acid sequences of PMK from the indicated species. Homology level was highlighted by shading in color: black for 100%, pink for ≥ 75% and blue for ≥ 50% identity. The three conserved functional motifs (MI, MII and MIII) are framed in red.
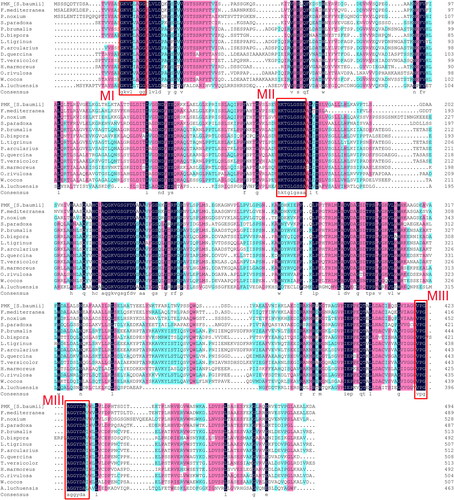
Figure 4. Heterologous expression of SbPMK in E. coli following IPTG induction (1 mmol/L). The bands indicated by the red arrow are target proteins. Lane M, protein molecular weight marker (Solarbio, Beijing, China); Lane 1, blank control group: E. coli harbouring empty vector; Lane 2–7, E. coli harbouring pET-32a-SbPMK induced by IPTG at 0 h, 2 h, 4 h, 6 h, 8 h, 10 h.
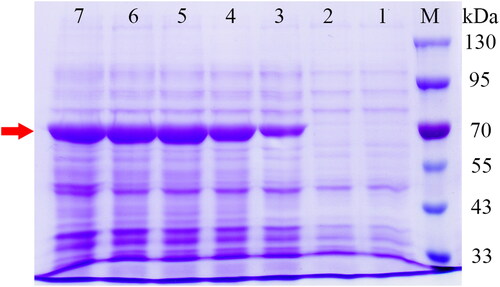
Figure 5. The biomass of mycelia during the fermentation of S. baumii.
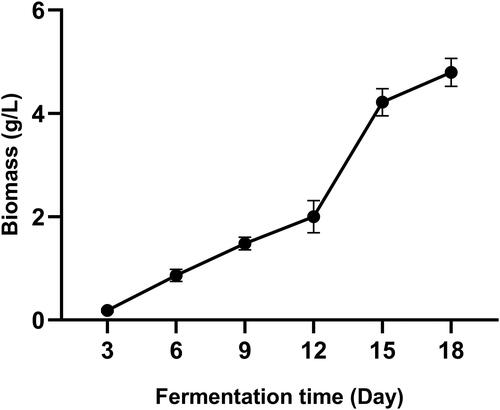
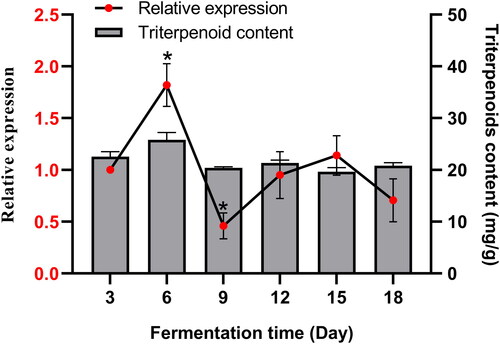
Figure 6. Relative expression level of SbPMK and triterpenoid contents during S. baumii fermentation. The values with * are significantly different (p < 0.05).
Data availability
All data that support the findings reported in this study are available from the corresponding author upon reasonable request.