
Figures & data
Figure 1. Workflow of the network pharmacological investigation on the potential use of cannabis in EP treatment.
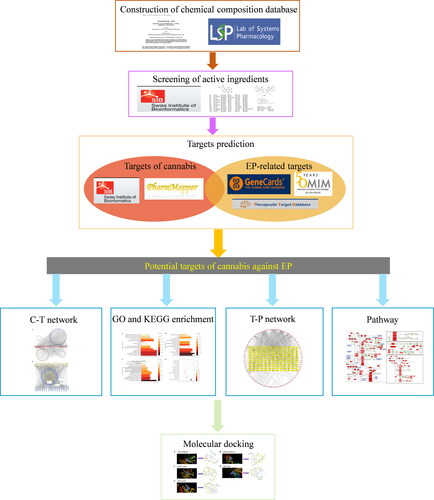
Figure 2. Venn diagram between cannabis targets and epileptic targets.
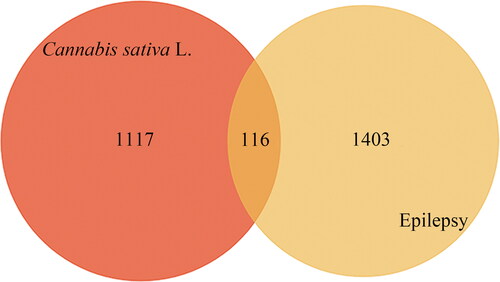
Table 1. 235 potential active ingredients and ADME parameters of Cannabis sativa L.
Table 2. Information on 116 potential targets of Cannabis sativa L.
Figure 3. C-T network. (A) The compound – target network of all compounds. (B) The compound – target network of cannabinoids.
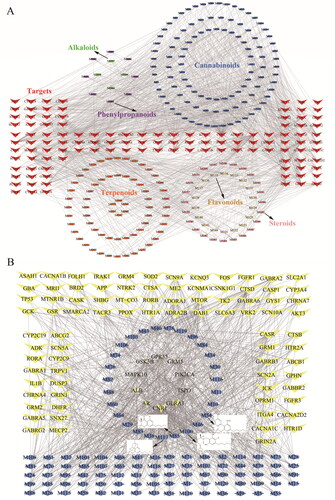
Figure 4. Enrichment analysis of potential targets from main active ingredients of cannabis. (A) Gene Ontology terms for molecular function. (B) Gene Ontology terms for biological process. (C) Gene Ontology terms for cellular component. (D) KEGG pathways.
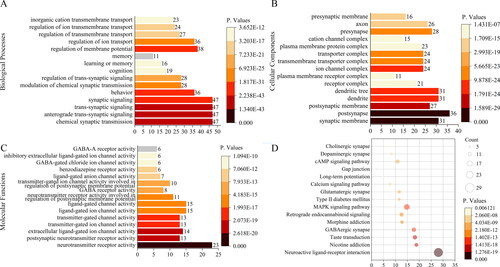
Figure 5. The T–P network.
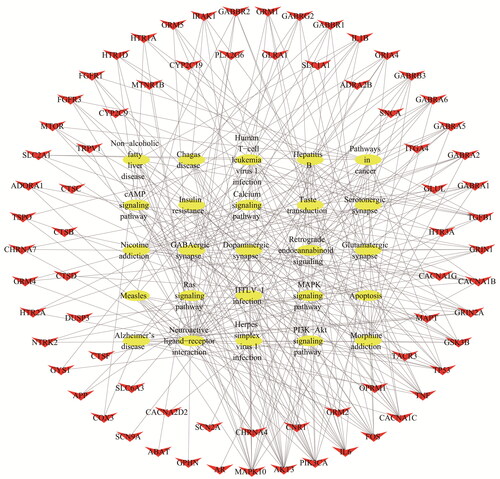
Figure 6. ‘EP’ pathway. (A) Distribution of targets of cannabis on compressed ‘EP pathway’. (B) Calcium signalling pathway. (C) MAPK signalling pathway. (D) Synaptic connections.
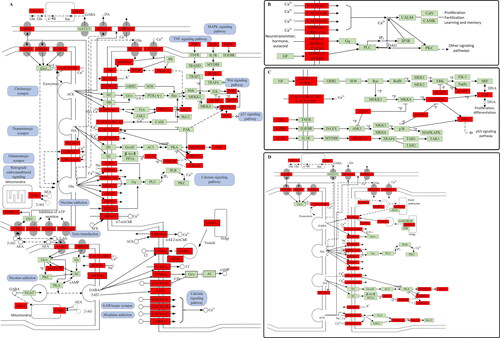
Figure 7. Schematic 3 D representation that the molecular docking model. (A) Binding mode of M10 to GSK3B. (B) Binding mode of M46 to MAPK10. (C) Binding mode of M54 to CNR1. (D) Binding mode of M54 to AR. (E) Binding mode of M34 to ALB.
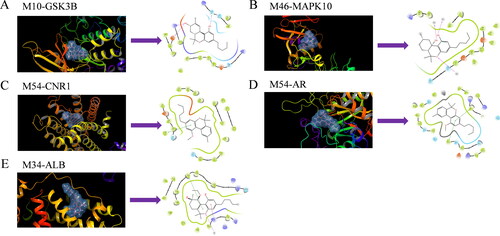
Table 3. Molecule docking scores for potential active ingredients with targets.
Data availability
The data supporting the findings reported in this study are available from the corresponding author upon reasonable request.