
Figures & data
Table 1. Locality and geographic coordinates of sediment samples.
Table 2. List of selective media used and codes of isolates.
Table 3. Oligonucleotide primers used for 16S rRNA PCR amplification and sequencing.
Table 4. Primers used for amplification of NRPS, PKS-I and II gene regions.
Table 5. Summary of information on 16S rRNA sequence determination of isolated strains.
Figure 1. Neighbor-joining tree [Citation20] based on 16S rRNA gene sequences showing the position of isolated Streptomyces strains among their phylogenetic neighbors. Numbers at the nodes demonstrate the levels of bootstrap support (%); only values ≥ 50% are shown. GenBank accession numbers are placed in parentheses. Bar, 0.005 substitutions per nucleotide position.
![Figure 1. Neighbor-joining tree [Citation20] based on 16S rRNA gene sequences showing the position of isolated Streptomyces strains among their phylogenetic neighbors. Numbers at the nodes demonstrate the levels of bootstrap support (%); only values ≥ 50% are shown. GenBank accession numbers are placed in parentheses. Bar, 0.005 substitutions per nucleotide position.](/cms/asset/6bd92770-cd62-41d6-942a-52f2cb3409f8/tbeq_a_1952898_f0001_b.jpg)
Figure 2. Neighbor-joining tree [Citation20] based on 16S rRNA gene sequences showing the position of isolated Micromonospora strains among their phylogenetic neighbors. Numbers at the nodes demonstrate the levels of bootstrap support (%); only values ≥ 50% are shown. GenBank accession numbers are placed in parentheses. Bar, 0.1 substitutions per nucleotide position.
![Figure 2. Neighbor-joining tree [Citation20] based on 16S rRNA gene sequences showing the position of isolated Micromonospora strains among their phylogenetic neighbors. Numbers at the nodes demonstrate the levels of bootstrap support (%); only values ≥ 50% are shown. GenBank accession numbers are placed in parentheses. Bar, 0.1 substitutions per nucleotide position.](/cms/asset/60278c41-816a-4ef6-8199-631fd90d413f/tbeq_a_1952898_f0002_b.jpg)
Figure 3. Neighbor-joining tree [Citation20] based on 16S rRNA gene sequences showing relationships between the isolates and recognized species of the genera Rhodococcus, Plantactinospora, Nonomuraea, Streptosporangium and Actinomadura strains among their phylogenetic neighbors. The numbers at the nodes demonstrate the levels of bootstrap support (%); only values ≥ 50% are given. GenBank accession numbers are placed in parentheses. Bar, 0.01 substitutions per nucleotide position.
![Figure 3. Neighbor-joining tree [Citation20] based on 16S rRNA gene sequences showing relationships between the isolates and recognized species of the genera Rhodococcus, Plantactinospora, Nonomuraea, Streptosporangium and Actinomadura strains among their phylogenetic neighbors. The numbers at the nodes demonstrate the levels of bootstrap support (%); only values ≥ 50% are given. GenBank accession numbers are placed in parentheses. Bar, 0.01 substitutions per nucleotide position.](/cms/asset/93723d79-cada-41d0-8d00-ee997accf205/tbeq_a_1952898_f0003_b.jpg)
Table 6. Inhibition zone diameters caused by test organisms against different microorganisms (mm).
Figure 4. Images of PKS-I and PKS-II gene regions PCR amplification products of positive isolates in 1.5% agarose gel. EtBr was added to the gel before electrophoresis to a final concentration of 0.5 μg/mL, followed by separation at 100 V for 1 h. Marker (Biolabs 1 kb DNA Ladder).
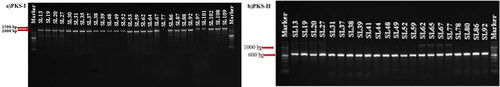
Table 7. PCR amplification results of NRPS, PKS-I and PKS-II gene regions of test isolates.
Data availability
All data that support the findings reported in this study are available from the corresponding author upon reasonable request.