
Figures & data
Table 1. PBD for the screening of significant factors affecting AMEP412 production.
Table 2. Levels of the factors tested in the experimental CCD.
Table 3. CCD matrixes for the experimental design and observed response for AMEP412.
Figure 1. SDS-PAGE detection of AMEP412 before and after purification.1, AMEP412 before purification; 2, AMEP412 after purification; M, low molecular weight protein marker.
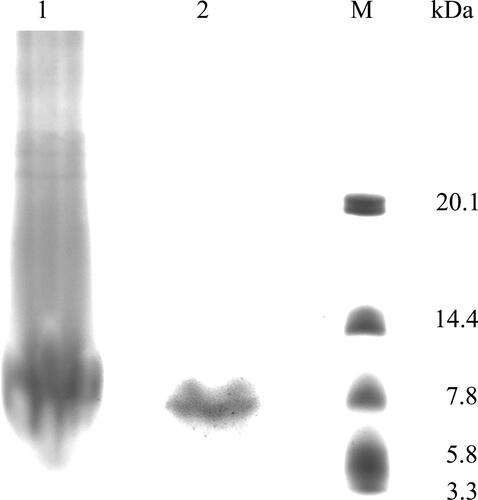
Table 4. Effect of various carbon and nitrogen sources on AMEP412 production.
Table 5. Analysis of variance (ANOVA) for the PBD results.
Table 6. Analysis of variance (ANOVA) for the CCD experimental results.
Figure 2. Response surface plot for AMEP412 yield as a function of yeast extract and culture temperature.
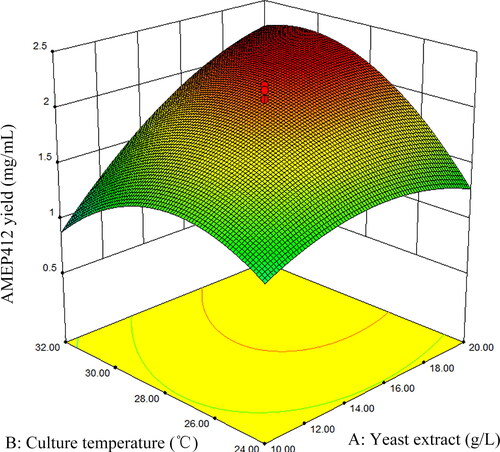
Figure 3. Response surface plot for AMEP412 yield as a function of yeast extract and culture time.
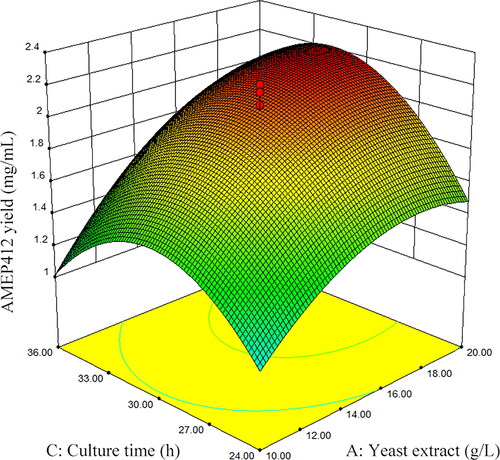
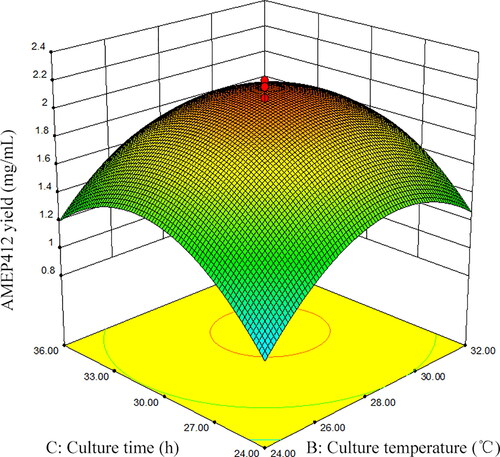
Figure 4. Response surface plot for AMEP412 yield as a function of temperature and culture time.
Data availability statement
All data that support the findings of this study are available from the corresponding authors upon reasonable request.