
Figures & data
Table 1. Input parameters for the nanoindentation experiments.
Figure 1. XRD pattern of as received and clinically retrieved Bio-active™ archwires.
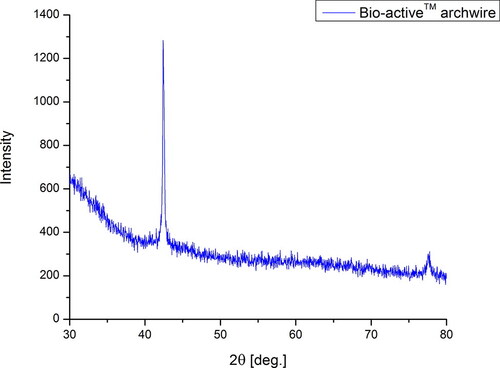
Figure 2. SEM micrographs of the surface of the upper wires: as received (a), used for 6 weeks (b) and used for 9 weeks (c). From left to right: ant., bic., post. (the 2 μm micrographs are visualized at ×5000 magn., while the 200 nm micrographs are visualized at ×50,000 magn.).
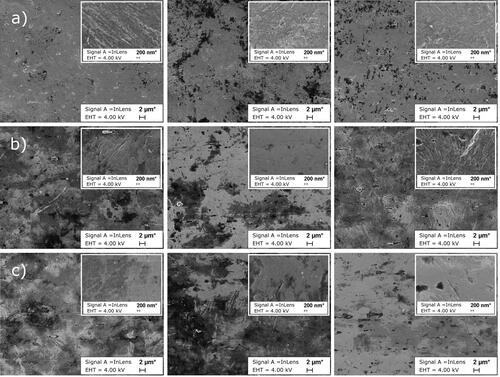
Figure 3. Representative SEM (a) micrograph (×2000 magn.) and EDS spectra (b) of the surface of Bio-active™ archwires.
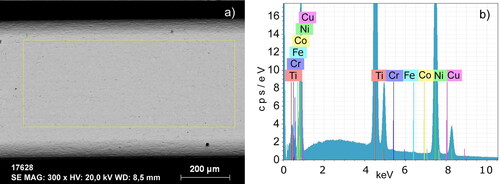
Table 2. Mean values for the surface elemental composition of the investigated Bio-active™ archwires.
Table 3. Elemental composition of the anterior region of Bio-active™ archwires as received (surface) and bicuspid area of used for nine weeks (cross-section).
Figure 4. SEM micrographs of anterior region (a) of as received (surface) (×5000 magn.) and bicuspid region (b) of Bio-active™ archwires used for nine weeks (cross-section) (×2000 magn.).
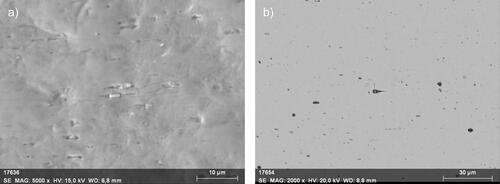
Figure 5. LIBS spectra of the investigated Bio-active™ archwires, showing the presence of Fe.
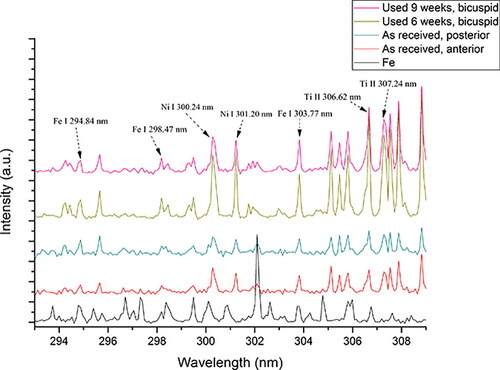
Figure 6. LIBS spectra of the investigated Bio-active™ archwires, showing the presence of Cr.
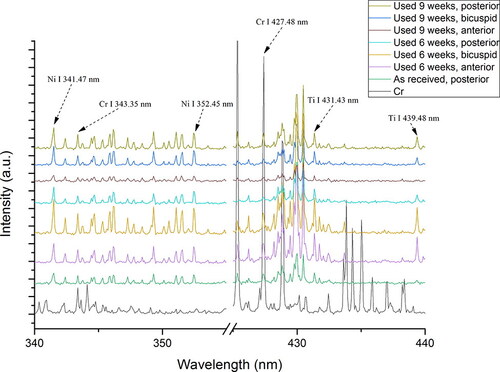
Figure 7. Indentation hardness (a) and indentation modulus (b) of investigated Bio-active™ archwires.
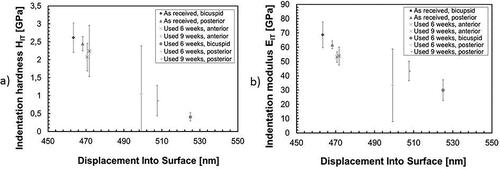
Figure 8. Anterior segment statistical results for Ni content dynamics.
Note: Different colours indicate statistically significant differences (p < 0.05).
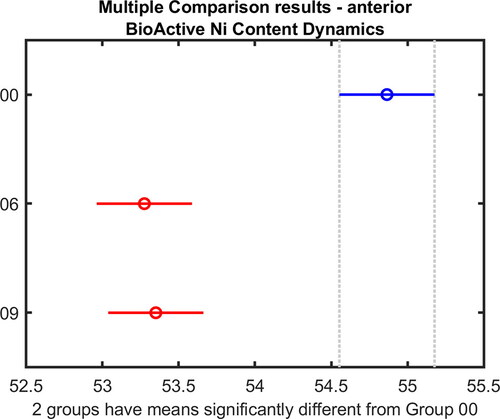
Figure 9. Bicuspid segment statistical results for Ni content dynamics (a) and Ti content dynamics (b).
Note: Different colours indicate statistically significant differences (p < 0.05).
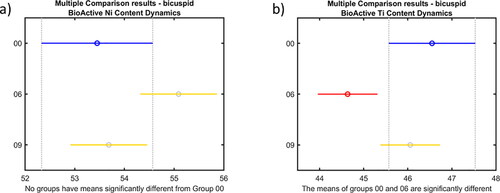
Figure 10. Bicuspid segment statistical results for indentation modulus dynamics (a) and bicuspid segment statistical results for indentation hardness dynamics (b).
Note: Different colours indicate statistically significant differences (p < 0.05).
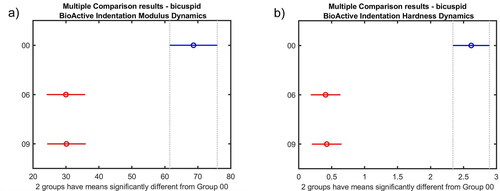
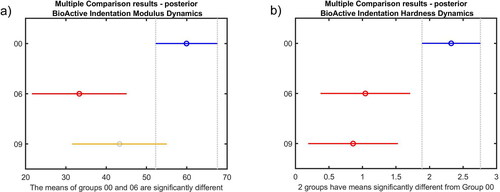
Figure 11. Posterior segment statistical results for Indentation Modulus dynamics (a) and Posterior segment statistical results for Indentation Hardness dynamics (b).
Note: Different colours indicate statistically significant differences(p < 0.05).
Data availability
All data that support the findings reported in this study are available from the corresponding author upon reasonable request.