
Figures & data
Figure 1. PUR block with designed holes for thermocouples in the direction perpendicular to the drilling direction.
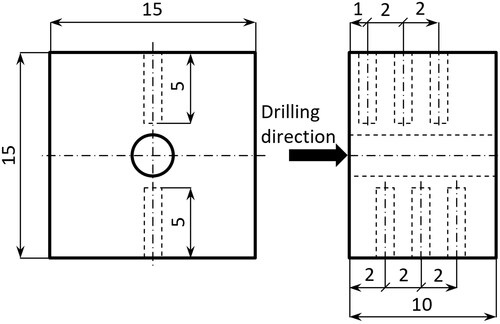
Figure 2. Different drills used in this study: Drill no. 1610.928b Ihde Dental (a), Drill no. 1610.928b-k Dentamechanik (b), Drill no. 1610.914d Ihde Dental (c), Drill no. 1610.914d-k Dentamechanik (d).
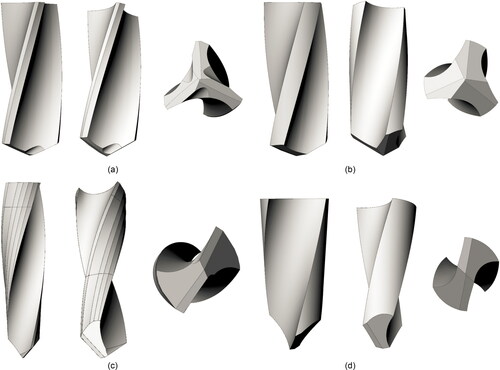
Table 1. Table of material properties for used stainless alloy 1.4112 and polyurethane foam (PUR).
Table 2. Experimentally detected temperature of four different drills during three rotational speeds.
Table 3. Experimentally detected temperature of four different drills during three rotational speeds.
Figure 3. Figures of temperature T (°C) distribution on IhdeDental 1610.928b drill (left) and PUR foam (middle), Von Misses reduced stress σred (MPa) distribution on the drill (right).
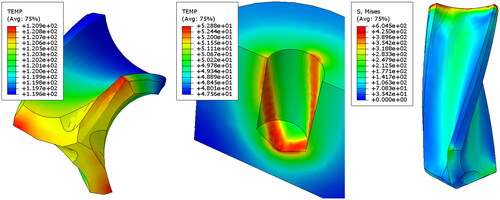
Figure 4. Figures of temperature T (°C) distribution on Dentamechanik 1610.928b-k drill (left) and PUR foam (middle), Von Misses reduced stress σred (MPa) distribution on the drill (right).
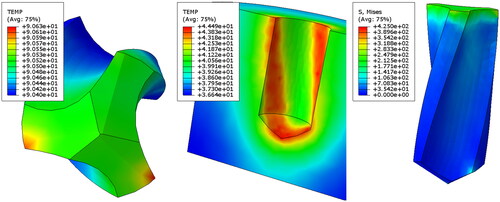
Figure 5. Figures of temperature T (°C) distribution on IhdeDental 1610.914d drill (left) and PUR foam (middle), Von Misses reduced stress σred (MPa) distribution on the drill (right).
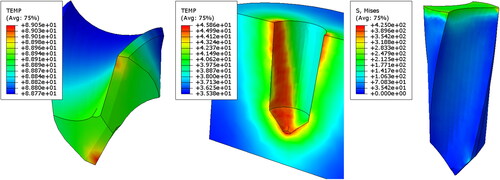
Figure 6. Figures of temperature T (°C) distribution on Dentamechanik 1610.914d-k drill (left) and PUR foam (middle), Von Misses reduced stress σred (MPa) distribution on the drill (right).
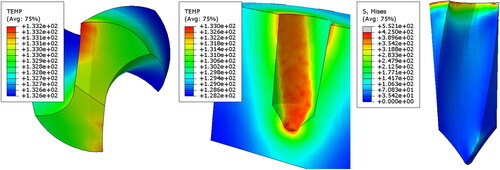
Table 4. Results from numerical analyses.
Table 6. Maximal temperatures (°C) obtained from experimental measurements and FE analyses.
Data availability statement
Data about the article are available at DOI: 10.6084/m9.figshare.14173457