
Figures & data
Table 1. Independent variables and their levels in the response surface design.
Figure 1. Effect of chelation time (A), zinc (II) initial concentration (B) and mass ratio of IP3a to zinc sulfate heptahydrate (C) on chelation rate of IP3a-Zn.
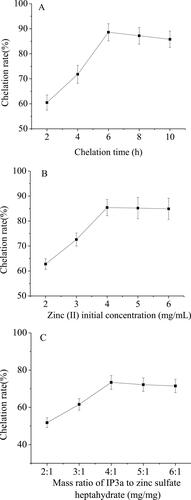
Table 2. Result of response surface analysis of the variation of chelation rate of IP3a-Zn with chelation time (X1), Zinc (II) initial concentration (X2) and mass ratio of IP3a to zinc sulfate heptahydrate (X3).
Table 3. ANOVA for response surface quadratic model.
Figure 2. Response surface plots showing the effect of chelation time and zinc (II) initial concentration (A), chelation time and mass ratio of IP3a to zinc sulfate heptahydrate (B) and zinc (II) initial concentration and mass ratio of IP3a to zinc sulfate heptahydrate (C) on chelation rate of IP3a-Zn.
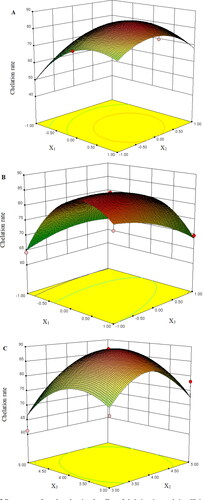
Table 4. Results of determination of zinc content in IP3a-Zn and IP3a.
Figure 3. FT-IR spectroscopy analysis of IP3a-Zn and IP3a.
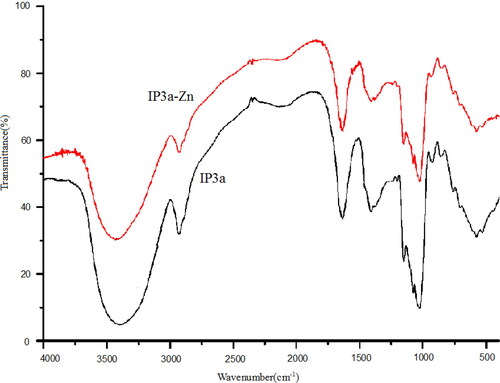
Figure 4. Scanning electron microscope image of IP3a (A) and IP3a-Zn (B) at 5000×.
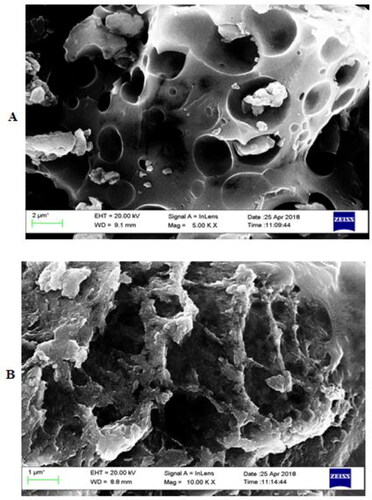
Figure 5. X-ray diffraction spectrum profile of IP3a and IP3a-Zn.
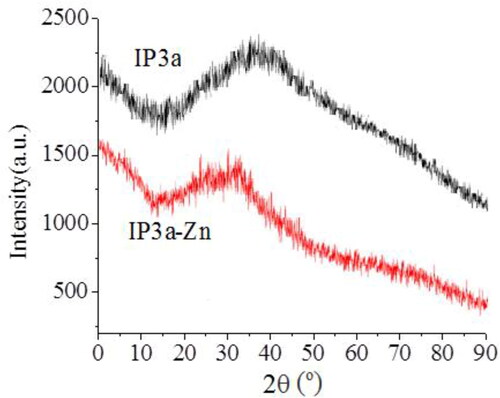
Figure 6. Thermogravimetric curve of IP3a and IP3a-Zn.
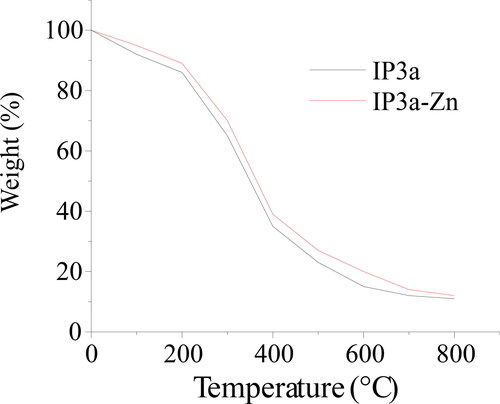
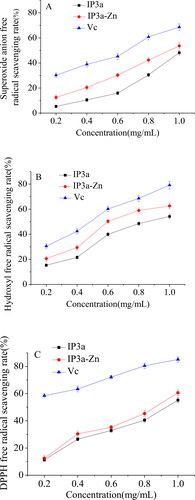
Figure 7. Scavenging effect of IP3a and IP3a-Zn on superoxide anion free radical (A), hydroxyl free radical (B) and DPPH free radical (C).
Data availability statement
All data that support the findings reported in this study are available from the corresponding author upon reasonable request.