
Figures & data
Figure 1. MIC of tested disinfectants at the selected pH ranges. Concentrations of disinfectants are expressed in µmol/L and data were obtained by three independent experiments.
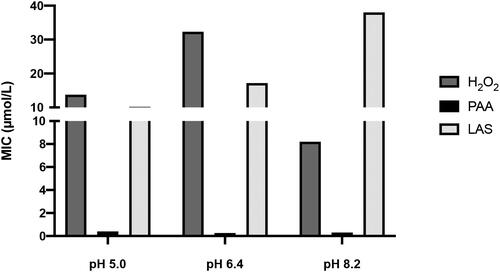
Figure 2. Effects of alkaline treatments (a) and LAS treatment (b) on protein carbonylation Effects of alkaline treatments on total thiols (c) and LMWT (d). Effects of LAS treatment on total thiols (e) and LMWT (f). Thiols concentration is expressed in nmol/mg protein.
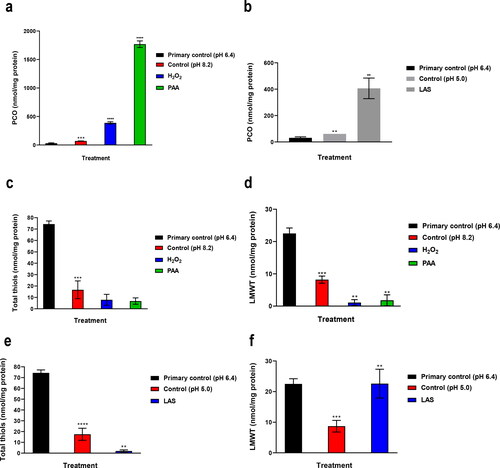
Table 1. Effect of pH alone on protein carbonylation.
Table 2. Effect of pH alone on total thiols.
Figure 3. Effect of pH alone (a), alkaline treatments (b) and LAS treatment (c) on SOD and catalase activities. Electron paramagnetic resonance spectra (d) for samples supernatants. Supernatants for EPR experiments were obtained after bacterial exposure to pH 6.4 (primary control); pH 8.2 (control for PAA, H2O2); pH 5.0 (control for LAS); H2O2; PAA; LAS. Each sample contained 10 µg/mL soluble proteins.
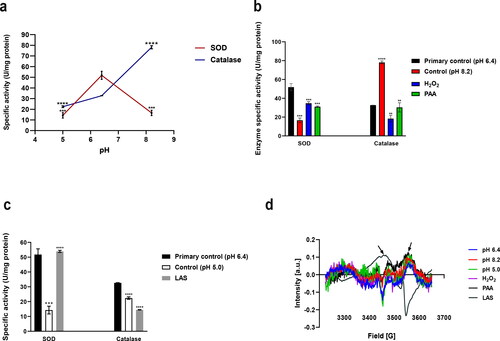
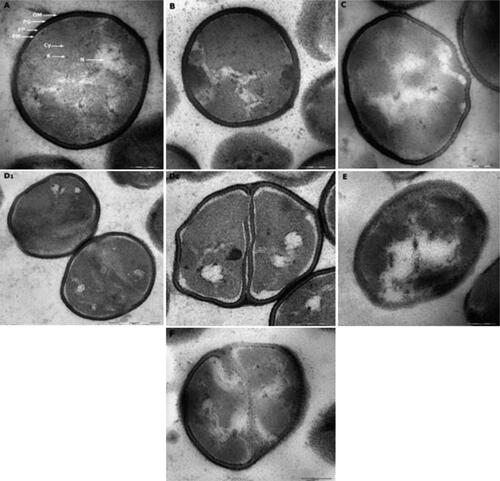
Figure 4. P. fluorescens grown in TSB culture medium of pH 6.4 (primary control) presented no alterations in their features and even distribution of cytoplasmic structures (A). Cells exposed to alkaline conditions of pH 8.2 (control for PAA and H2O2) presented less dispersed, more confined nucleoid and electrodense structures accumulation (B). Cells exposed to acidic environment of pH 5.0 (control for LAS) (C) showed empty appearing vacuoles and deformed membranes. Cells treated with LAS showed corrugated membranes, empty vacuoles and black cytoplasmic condensations (D1, D2). Bacteria treated with PAA showed cytoplasmic vacuolization, protein accumulation, asymmetric and damaged membranes (E). Cells treated with H2O2 showed cytoplasmic vacuoles, distinct alteration of cell components with electrodense structures, and membranous bleb-like bulge indicating cell damage (F). OM, outer membrane; PG, peptidoglycan; PP, periplasm; PM, plasma membrane; N, nucleoid; Cy, cytoplasm; R, ribosomes. Scale bar = 200 nm (A, B, C, D2, E, F), 500 nm (D1).
Availability of data and materials
Data and materials related to this study are available upon reasonable request.
Data availability statement
All data that support the findings reported in this manuscript are available from the author upon reasonable request.