Figures & data
Figure 1. Morphologies of 8 different developmental stages. A: Flower bud formation; B: The initial inflorescence primordia formation; C: New inflorescence primordia formed continuously; D: The primordium of initial inflorescence began to differentiate, the calyx formed, and the primordium began to expand and separate from the calyx; E: The floral primordia expanded further and separated from the calyx, and the primordium had a tendency toward primary differentiation; F: Three primordia: petal, stamen and carpel; G: The petals began to stratify, the anthers began to expand, and the pistils formed ovules and the polar nucleus; H: The flower morphology was completed, the number of petals was determined, the anther development was completed, the pollen was wrapped, and the pistil structure was established.
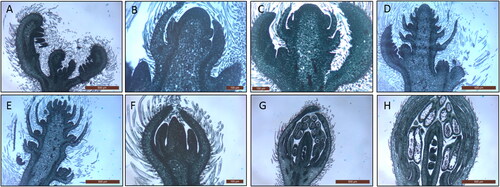
Table 1. The microwave digestion procedure.
Figure 2. SOM cluster analysis. A: roots; B: stem; C: leaves.
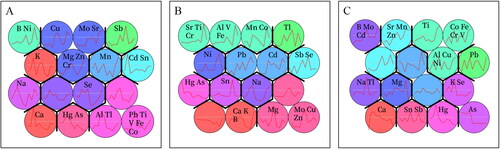
Figure 3. The correlation analysis of elements (A: roots; B: stem; C: leaves).
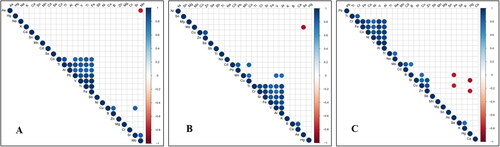
Figure 4. Cluster dendrogram and modules.
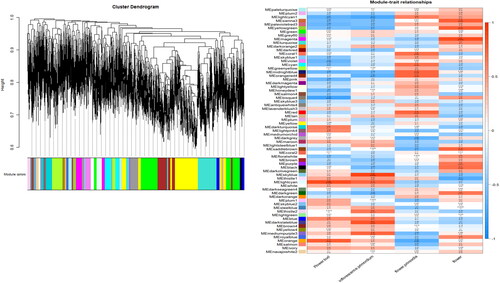
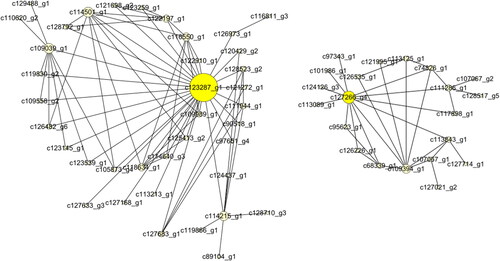
Figure 5. The network of the lightcyan module.
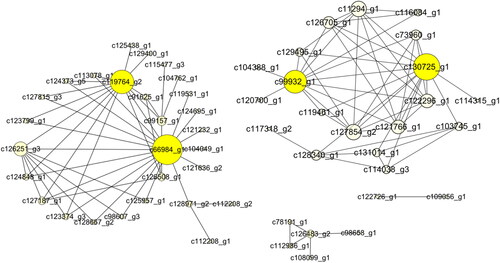
Figure 6. The network of the skyblue module.
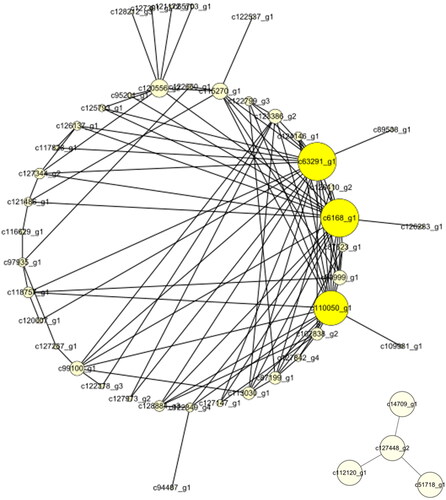
Figure 7. The network of the midnightblue module.
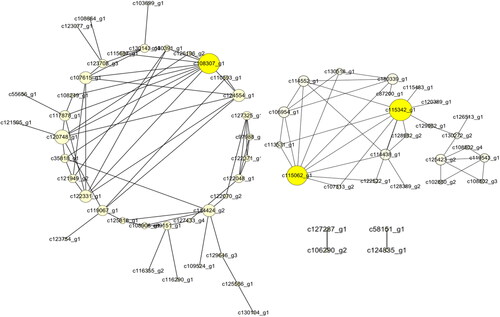
Figure 8. The network of the magenta module.