
Figures & data
Figure 1. Effect of oligomycin-A (100 ng/mL) on the cell viability and proliferation of M/A-treated leukaemic lymphocytes (Jurkat) after 24 h and 48 h of incubation in humidified atmosphere. Data are means ± SD from three independent experiments with two parallel measurements for each experiment. *p < 0.05, **p < 0.01: oligomycin/M/A-treated versus the respective M/A-treated cells or oligomycin-treated sample versus the untreated cells (control). Red dashed line indicates the initial cell number in the suspension.
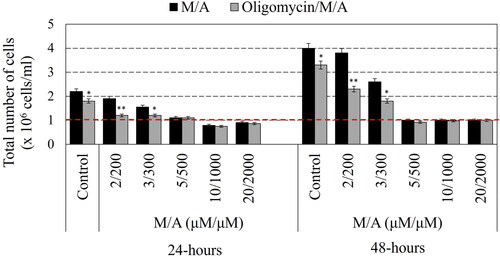
Figure 2. Effect of oligomycin-A (100 ng/mL) on the absolute steady-state ATP levels in M/A-treated leukaemic lymphocytes (Jurkat) after 24 h and 48 h of incubation in humidified atmosphere. Data are means ± SD from three independent experiments with four parallel measurements for each experiment. *p < 0.05, **p < 0.01, p < 0.001: oligomycin/M/A-treated versus the respective M/A-treated cells or oligomycin-treated sample versus the untreated cells (control). ATP-based luminescence in the untreated cells was considered 100%.
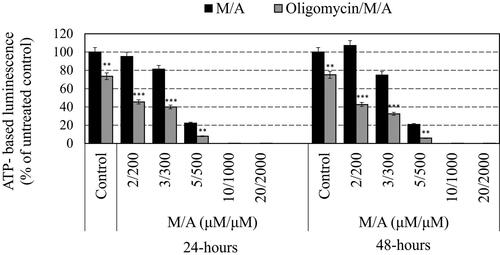
Figure 3. Effect of oligomycin-A (100 ng/mL) on the normalized steady-state ATP levels in M/A-treated leukaemic lymphocytes (Jurkat) after 24 h and 48 h of incubation in humidified atmosphere. Data are means ± SD from three independent experiments with four parallel measurements for each experiment. *p < 0.05, **p < 0.01, ***p < 0.001: oligomycin/M/A-treated versus the respective M/A-treated cells or oligomycin-treated sample versus the untreated cells (control). Data were normalized to an equal number of live cells in each sample (1 × 10⁶ cells), as only living cells synthesize ATP. Normalized ATP-based luminescence in the untreated cells was considered 100%.
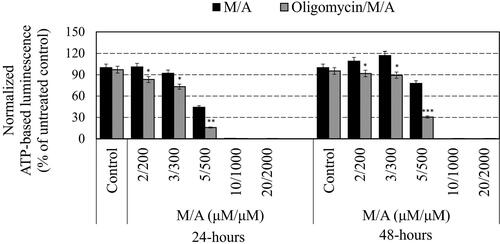
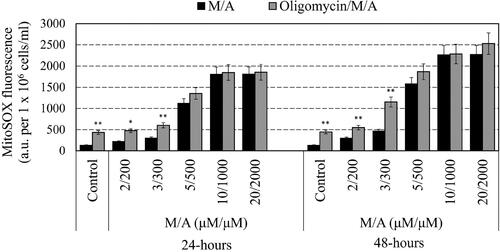
Figure 4. Effect of oligomycin-A (100 ng/mL) on the mitochondrial superoxide of M/A-treated leukaemic lymphocytes (Jurkat) after 24 h and 48 h of incubation in humidified atmosphere. Data are means ± SD from three independent experiments with two parallel measurements for each experiment. *p < 0.05, **p < 0.01: oligomycin/M/A-treated versus the respective M/A-treated cells or oligomycin-treated sample versus the untreated cells (control).
Data availability statement
The data that support the findings of this study are available on request from the corresponding authors (ZZ and BN).