
Figures & data
Figure 1. Dose-response curves of human cell lines HL-60, HL-60/Dox and MCF-7 cells after 72 h exposure to CBD.
Note: Data are expressed as means in three independent experiments; SD have been omitted for clarity; CBD, cannabidiol.
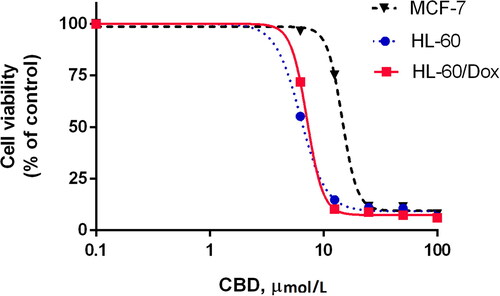
Figure 2. Cytotoxicity of CBD + EPI in leukemic cell lines HL-60 (a), HL-60/Dox (b), and breast cancer cells MCF-7: applied simultaneously (c) and in a drug sequence: CBD 24 h followed by EPI 48 h (d).
Note: Data are presented as tumor inhibition (T/C,%) ean ± SD *Legend: [
 ] CBD; [
 ] EPI + CBD; EPI, epirubicin; CBD, cannabidiol.
![Figure 2. Cytotoxicity of CBD + EPI in leukemic cell lines HL-60 (a), HL-60/Dox (b), and breast cancer cells MCF-7: applied simultaneously (c) and in a drug sequence: CBD 24 h followed by EPI 48 h (d).Note: Data are presented as tumor inhibition (T/C,%) ean ± SD *Legend: [Display full size] EPI; [Display full size] CBD; [Display full size] EPI + CBD; EPI, epirubicin; CBD, cannabidiol.](/cms/asset/3205c245-d7ce-4663-bd01-15999c6c8fca/tbeq_a_1996270_f0002_b.jpg)
Table 1. Combination index (CI) values of epirubicin in combination with varying concentrations of cannabidiol on three tumor cell lines*.
Table 2. Combination index (CI) values of epirubicin plus cannabidiol at fixed-ratio concentrations of 1:10 on three tumor cell lines*.
Table 3. Dose reduction index (DRI) values of EPI and CBD at fixed-ratio concentrations of 1:10 on HL-60 and MCF-7 cells*.
Figure 3. Degree of 2-deoxyribose (DR) oxidative damage in the absence or presence of different concentrations of EPI and CBD, applied by themselves or simultaneously at fixed-ratio concentrations of 1:10.
Note: Data are presented as percentage of molecular damage, mean ± SD. Groups were compared by one-way ANOVA with Bonferroni post hoc test. Asterisks indicate statistically significant differences versus the control: **p < 0.01, ***p < 0.001 [
 ] CBD; [
 ] EPI + CBD; EPI, epirubicin; CBD, cannabidiol.
![Figure 3. Degree of 2-deoxyribose (DR) oxidative damage in the absence or presence of different concentrations of EPI and CBD, applied by themselves or simultaneously at fixed-ratio concentrations of 1:10.Note: Data are presented as percentage of molecular damage, mean ± SD. Groups were compared by one-way ANOVA with Bonferroni post hoc test. Asterisks indicate statistically significant differences versus the control: **p < 0.01, ***p < 0.001 [Display full size] EPI; [Display full size] CBD; [Display full size] EPI + CBD; EPI, epirubicin; CBD, cannabidiol.](/cms/asset/cc1183f1-2437-4506-bf30-2955e0716f49/tbeq_a_1996270_f0003_b.jpg)
Figure 4. Impact of the investigated combinations CBD + EPI on the luminol-dependent chemiluminescence in the presence of xanthine/xanthine oxidase-generated superoxide.
Note: Data are presented as means ± SD. Three parallel measurements were performed for each composition (n = 3), each representing an individual data point. The baseline was subtracted from both control and sample measurements: (1) Control measurement – 0.1 mL xanthine solution, 0.05 mL xanthine oxidase solution (2.9 mU), 0.1 mL luminol, 0.75 mL PBS; (2) Sample measurement – 0.1 mL xanthine solution, 0.05 mL xanthine oxidase solution (2.9 mU), 0.1 mL luminol, the necessary volumes of stock CBD and EPI solutions, PBS up to 1.0 mL; (3) Baseline sample measurement – 0.1 mL xanthine, 0.1 mL luminol, 0.8 mL PBS; [
![Figure 4. Impact of the investigated combinations CBD + EPI on the luminol-dependent chemiluminescence in the presence of xanthine/xanthine oxidase-generated superoxide.Note: Data are presented as means ± SD. Three parallel measurements were performed for each composition (n = 3), each representing an individual data point. The baseline was subtracted from both control and sample measurements: (1) Control measurement – 0.1 mL xanthine solution, 0.05 mL xanthine oxidase solution (2.9 mU), 0.1 mL luminol, 0.75 mL PBS; (2) Sample measurement – 0.1 mL xanthine solution, 0.05 mL xanthine oxidase solution (2.9 mU), 0.1 mL luminol, the necessary volumes of stock CBD and EPI solutions, PBS up to 1.0 mL; (3) Baseline sample measurement – 0.1 mL xanthine, 0.1 mL luminol, 0.8 mL PBS; [Display full size] EPI + CBD; EPI, epirubicin; CBD, cannabidiol.](/cms/asset/e8792fd7-372f-4e33-be7f-526872fe7d07/tbeq_a_1996270_f0004_c.jpg)
Table 4. Equieffective concentrations of EPI, CBD and their combination at fixed-ratio concentrations of 1:10 after 72 h exposure of HL-60 and MCF-7 cells, calculated using computer-simulated dose-response relationship*.
Data availability statement
The authors confirm that the data supporting the findings of this study are available within the article [and/or] its supplementary materials.