
Figures & data
Table 1. Statistics of the genetic map for the RIL population.
Figure 1. Phenotypic distribution of effective tiller number (ETN) in four environments. Different environments (E1–E4): 2017–18 (E1) and 2018–19 (E2), 2019–20 (E3), 2020–21 (E4).
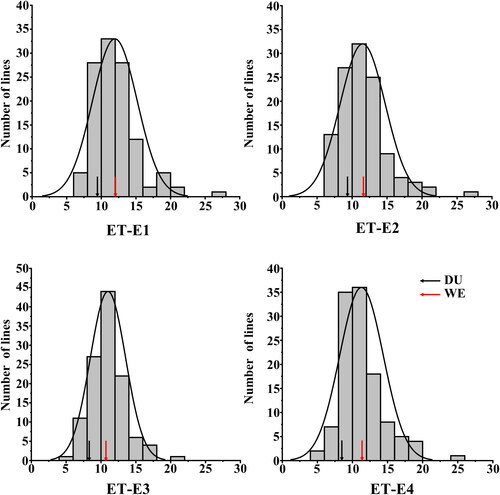
Table 2. Phenotypic data effective tiller number (ETN) for the DW population at different environments.
Table 3. Correlation coefficients of ET in different environments.
Table 4. Quantitative trait loci (QTL) for effective tiller number (ETN) identified in multiple environments in the DW population.
Figure 2. Genetic maps of the major QTL Qetn-DW-4B.1 and its effect. *Significance level at p < 0.05, **Significance level at p < 0.01.
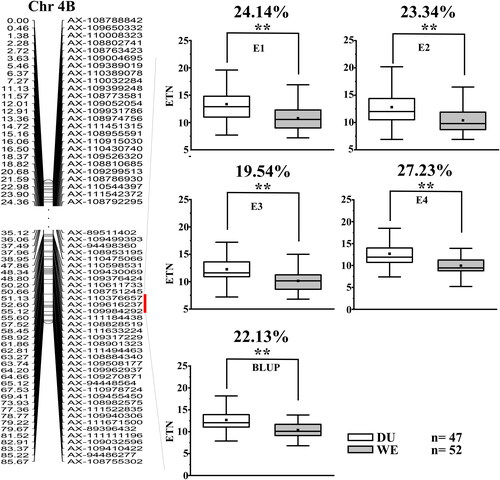
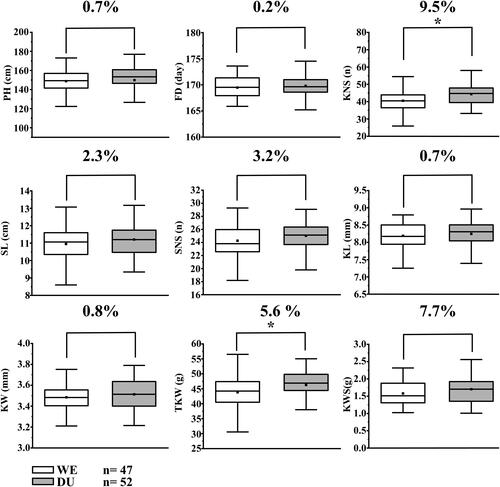
Figure 3. Student’s t-test against the two haplotype groups from DW population with the positive or negative alleles of Qetn -DW-4B.1 plant height (PH), flowering date (FD), kernel number per spike (KNS), spike length (SL), spikelet number per spike (SNS), kernel length (KL) and width (KW), thousand kernel weight (TKW), and kernel weight per spike (KWS). *Significance level at p < 0.05, **Significance level at p < 0.01.
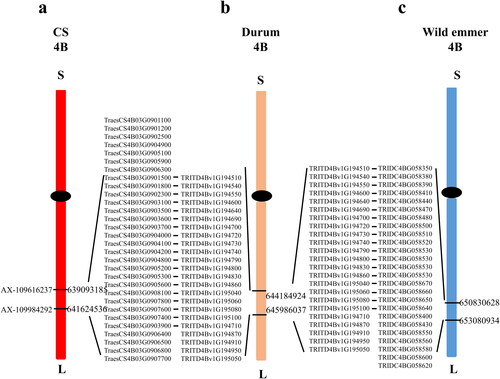
Figure 4. Orthologs in the intervals of the major QTL Qetn -DW-4B.1.
Supplemental Material
Download MS Excel (191.2 KB)Data availability statement
All data generated or analyzed during this study are included in this article and its supplementary information files; further inquiries can be directed to the corresponding author.