
Figures & data
Table 1. General metabarcoding sequencing results of the soil samples.
Figure 1. Differences in preservation methods and sequencing results of soil samples across the three groups. (a) The timeline of sample processing. (b) The Venn diagram of OTUs from metabarcoding sequencing, in which 16S rDNA represents bacteria and ITS represents fungi. (c) The rare faction curves of the 18 samples from 16S rDNA and ITS metabarcoding, in which the x-axis represents sequence volume and the y-axis represents OTU numbers.
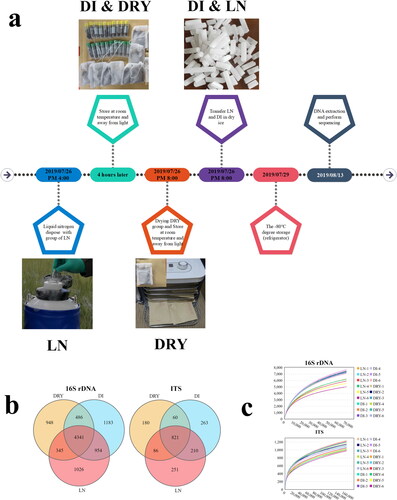
Figure 2. OTUs taxonomic analysis of the soil samples across the three groups. (a–d) Taxonomy of bacteria (a,c) and fungi (b,d) at phylum (a,b) and family (c,d) levels, in which the x-axis represents the sample identification number (ID) and the y-axis represents the relative abundance. (e,f) Heatmap of the top 10 families of bacteria (e) and fungi (f), in which the x-axis represents the sample ID and the y-axis represents the family. (g,h) The Kruskal-Wallis test of the top 5 families of bacteria (g) and fungi (h), in which the x-axis represents the relative abundance and the y-axis represents the family. Tricholomataceae was excluded from the results of fungi.
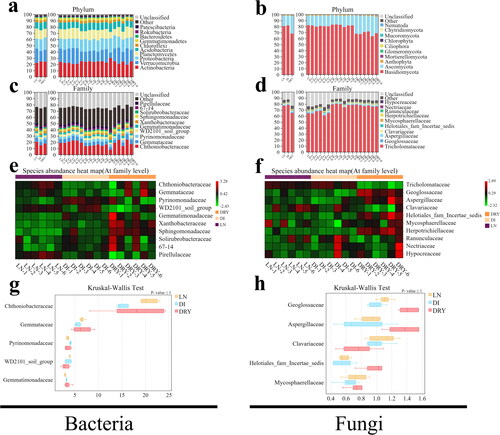
Table 2. Alpha diversity indices for the soil samples.
Figure 3. Inter-group analysis of alpha diversity. The x-axis represents the indices of alpha diversity and the y-axis represents the groups of soil samples.
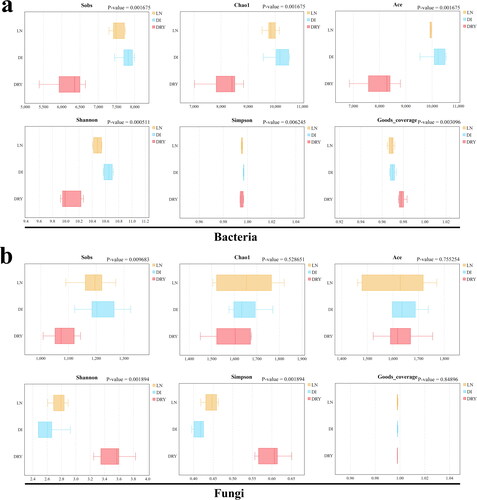
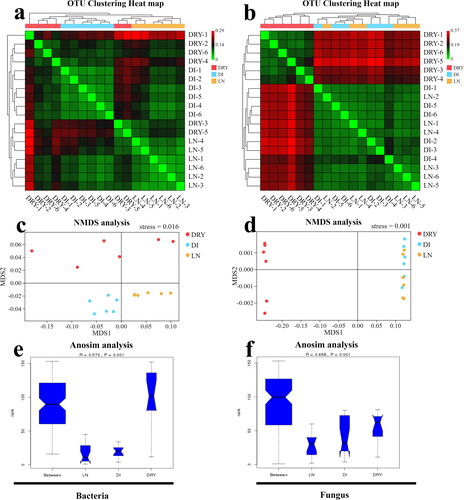
Figure 4. Beta diversity analysis of the soil samples across the three groups. (a,b) Heat map of weighted unifrac distance index based on UPGMA clustering from bacteria (a) and fungi (b), in which the bottom x-axis and right y-axis represent the sample ID, and the upper x-axis and left y-axis represent UPGMA clustering results. (c,d) The NMDS plot of bacteria (c) and fungi (d), in which MDS1 represents abundance distance matrix and MDS2 represents evolutionary distance matrix. (e,f) The map of Anosim analysis, in which the x-axis represents the group ID, the y-axis represents the relative difference grade, the R-value represents the difference level, and the P-value represents the significance of the difference.
Supplemental Material
Download Zip (76.3 KB)Data availability statement
The raw amplicon sequencing dataset is available in the NCBI Sequence Read Archive under BioProject ID: PRJNA635768.