
Figures & data
Table 1. SSR markers, major allele frequency, allele number, expected (He or GD), observed heterozygosity (Ho) and Polymorphic information content (PIC) in the studied wheat population consisting of 117 bread wheat varieties and across the three genomes.
Table 2. Comparison of genetic diversity among wheat populations with different geographical origin.
Figure 1. Genetic structure among the studied 117 wheat genotypes according to model-based analysis. (A) Optimal number of K determined using ΔK [Citation43]; (B) Resulting sub-populations at K = 2 and K = 3.
![Figure 1. Genetic structure among the studied 117 wheat genotypes according to model-based analysis. (A) Optimal number of K determined using ΔK [Citation43]; (B) Resulting sub-populations at K = 2 and K = 3.](/cms/asset/bd477144-c86e-4b05-83a3-dd69da7e6078/tbeq_a_1996274_f0001_c.jpg)
Figure 2. Groups inferred by DAPC analysis. (A) Visualization of the resulting groups with a minimum spanning tree; (B) Visualization of the agreement between the groups inferred by DAPC and STRUCTURE analysis. The columns represent the groups inferred by the DAPC analysis and the rows are the groups inferred by the STRUCTURE analysis. The numbers and the size of squares in the legend represent the number of genotypes in each group.
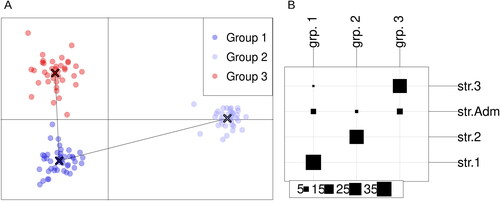
Figure 3. Comparison of allele frequencies between wheat varieties bred in North Bulgaria (BG_N) and South Bulgaria (BG_S) in four SSR loci showing highest contribution to the sub-population differentiation.
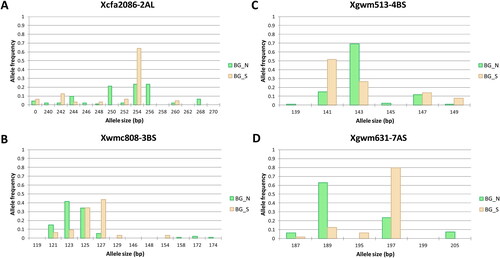
Figure 4. Phylogenetic tree of the collection of 117 European Triticum aestivum varieties. The tree was built using UPGMA algorithm based on Nei83 DA distance [Citation39] computed from the allele frequencies at 22 SSR loci. The origin of each variety is represented by abbreviations highlighted with different colours: AT – Austria, BG – Bulgaria, CZ – Czech Republic, DE – Germany, FR – France, HR – Croatia, RS – the Republic of Serbia. The abbreviations after the underscore: EE – East Europe, WE –West and Central Europe, N – Northern, S –Southern. The barplots to the right represent the membership to sub-populations inferred by the model-based approach at K = 2 and K = 3. The two main clusters are marked by vertical bars.
![Figure 4. Phylogenetic tree of the collection of 117 European Triticum aestivum varieties. The tree was built using UPGMA algorithm based on Nei83 DA distance [Citation39] computed from the allele frequencies at 22 SSR loci. The origin of each variety is represented by abbreviations highlighted with different colours: AT – Austria, BG – Bulgaria, CZ – Czech Republic, DE – Germany, FR – France, HR – Croatia, RS – the Republic of Serbia. The abbreviations after the underscore: EE – East Europe, WE –West and Central Europe, N – Northern, S –Southern. The barplots to the right represent the membership to sub-populations inferred by the model-based approach at K = 2 and K = 3. The two main clusters are marked by vertical bars.](/cms/asset/d4b91800-2067-47f2-ae96-cbc0a60e3f56/tbeq_a_1996274_f0004_c.jpg)
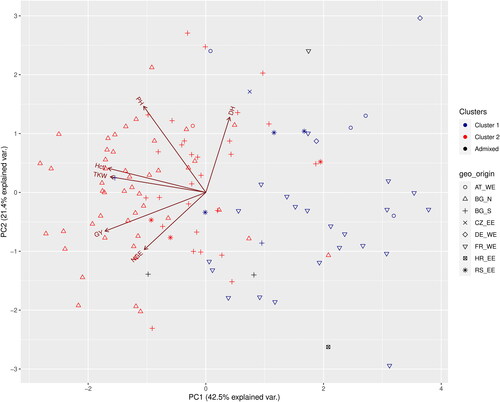
Figure 5. PCA biplot of six quantitative traits and the distribution of the genotypes at K = 2. The cluster memberships are coded in colours and the country of origin in shapes. GY – grain yield, DH – days to heading, Hctl – hectolitre weight, NGE – number of grains per ear, PH – plant height, TKW – thousand kernel weight.
Data availability statement
All data that support the findings reported in this study are available from the corresponding author upon reasonable request.