
Figures & data
Figure 1. Schematic diagram of the prototype household bubble column PBR. 1: Observatory window and front door; 2: controlling panel; 3: PBR upper cover; 4: PBR column; 5: LED light source panel; 6: aeration pipe; 7: water tap.
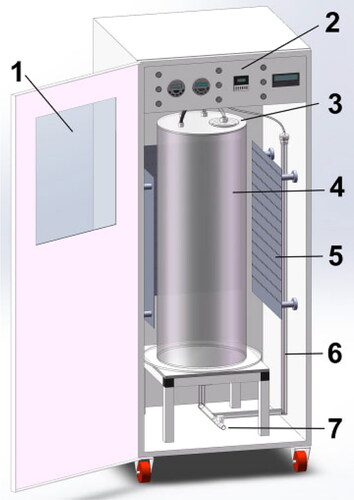
Table 1. Concentration of nutrients in the cultivation medium used in this study.
Table 2. Harvesting events throughout the 107 cultivation days.
Table 3. Nutrient replenishment and CO2 aeration events throughout the 107 cultivation days.
Figure 2. Relationships between: (A) concentration change and AB560nm; (B) real harvest and estimated harvest.
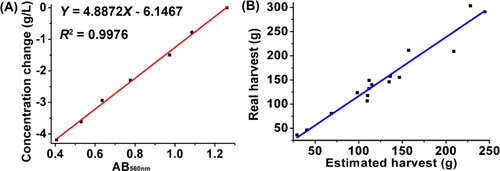
Table 4. Harvesting experiment conducted on Day 41.
Figure 3. Variations of Cbiomass and N, P, Mg, K, Fe concentrations during cultivation. (A) Change of the Cbiomass (left) and the five nutrient contents normalized to their values of Day 1 (right), with harvesting (yellow bars) and salt replenishing (purple bars) events marked in the picture; (B) Declining trends of the five nutrient contents. The data were taken from where the values decreased steadily and pieced together to show a continuous trend.
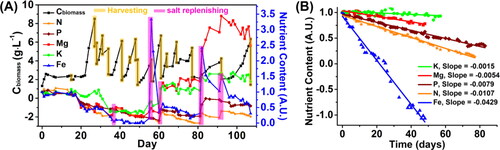
Figure 4. Variations of Cbiomass and pH during cultivation. (A) Comparison between the Cbiomass and pH variations during cultivation; (B) Change rate of Cbiomass (g·L−1·d−1) vs. that of pH (d−1).
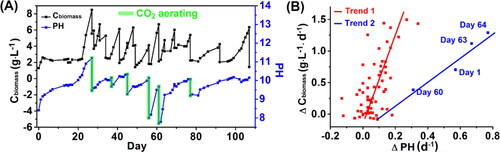
Figure 5. Ozone sterilization effect to the Spirulina culture medium. (A) Variation of aerobic plate count (CFU/104) with increasing sterilization time; (B) Variation of aerobic plate count in the days before and after sterilization. The symbols 01st and 02nd in the figure represent the time points before and after sterilization on Day 77, respectively.
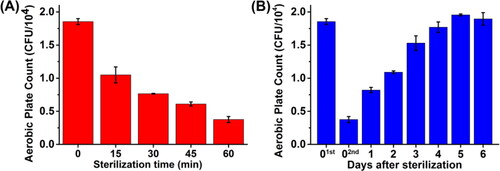
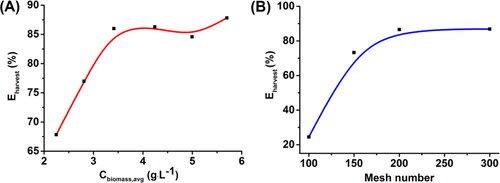
Figure 6. Influence of (A) average Cbiomass and (B) filtration sack mesh number on the harvest efficiency.
Data availability
The data that support the findings of this study are available from the corresponding author, Shudi Zhang, upon reasonable request.