
Figures & data
Figure 1. Design of the model biofilter.
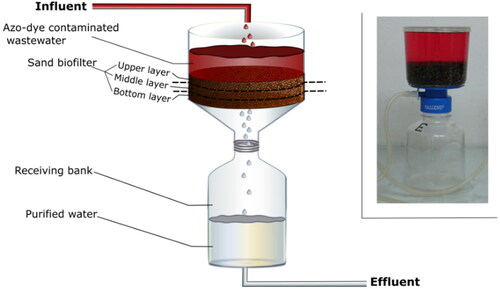
Figure 2. Pseudomonas sp. ratio to the total quantity of the microorganisms calculated on the basis of: FISH (a); plate count techniques (b).
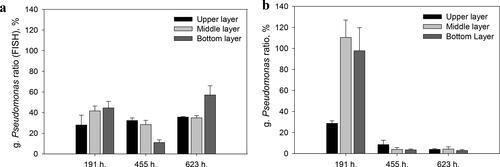
Table 1. Technological, microbiological and enzymological parameters of the downflow sand biofilter in: early stage of the model process (0 h. - 191 h), late stage of the model process (191 h – 455 h) and end of the experiment (455 h – 623 h).
Table 2. Key azo-degrading microorganisms’ ratio to the total quantity of the microorganisms calculated on the base of FISH and standard culture techniques.
Table 3. FISH of the biofilm from the three layers in the end of the process.
Data availability statement
The authors confirm that the data supporting the findings of this study are available within the article.