
Figures & data
Figure 1. Structures of coumarins in Bupleurum Chinese DC.
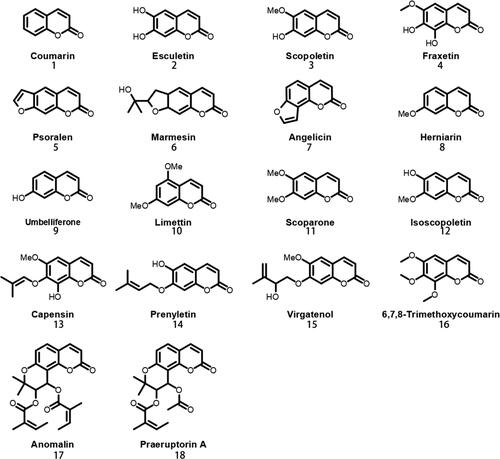
Table 1. Summary of Fraxetin, Angelicin, Psoralen, Esculetin, marmesin.
Figure 2. Phenylpropanoids general biosynthetic pathway.
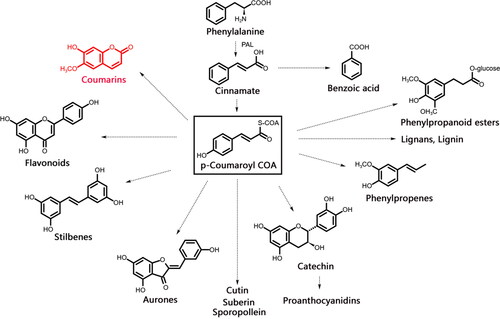
Figure 3. Putative biosynthetic pathways of coumarins in Bupleurum. PAL, phenylalanine ammonia lyase; C4H, cinnamate 4-hydroxylase; C3H, ρ-coumarate 3-hydroxylase; HCT, shikimate O-hydroxycinnamoyltransferase; COMT, caffeic acid ο-methyltransferase; 4CL, 4-coumarate: coenzyme A ligase; F6’H, feruloyl-CoA 6’-hydroxylase; PS,psoralen synthase.; C2’H, ρ-coumaroyl CoA 2’-hydroxylase; U-8-P, umbelliferone 8-prenyltransferase; CS, columbianetin synthase; AS, angelicin synthase; CA2H, caffeic acid 2-hydroxylase; OMT, ο-methyl-transferase; S8H, scopoletin 8-hydroxylase; *, no corresponding gene was found.
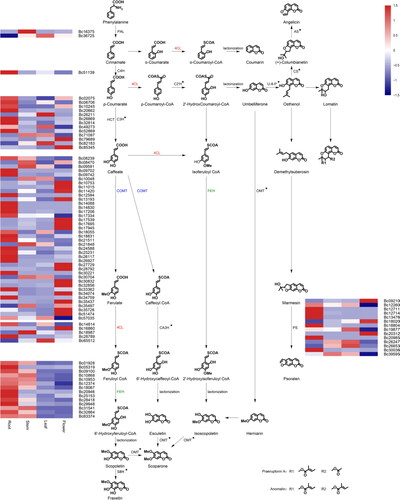
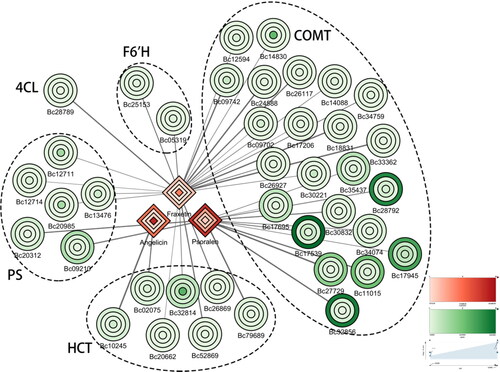
Figure 4. Connection network between regulatory genes and coumarins. The shapes represent roots, stems, leaves and flowers from the inside out; the expression levels of genes (green, ellipse) and metabolites (red, diamond) are indicated by shades of colour; the thickness of the line indicates the size of the correlation.
Supplemental Material
Download MS Excel (13 KB)Data availability statement
All data generated or analyzed during this study are included in this published article and its supplementary information files, further inquiries can be directed to the corresponding author.