
Figures & data
Table 1. Gradient program of HPLC.
Table 2. HPLC conditions and settings.
Figure 1. HPLC analysis. (A) Standard chromatogram. 1: Gallic Acid, 2: Protocatechic Acid, 3: Catechin, 4: P-Hydroxy Benzoic Acid, 5: Chlorogenic Acid, 6: Caffeic Acid, 7: Epicatechin, 8: Syringic Acid, 9: Vanilin, 10: P-Coumaric Acid, 11: Ferulic Acid, 12: Sinapinic Acid, 13: Benzoic Acid, 14: O-Coumaric Acid, 15: Rutin, 16: Hesperidin, 17: Rosmarinic Acid, 18: Eriodictiol, 19: Cinnamic Acid, 20: Quercetin, 21: Luteolin, 22: Kaempferol, 23: Apigenin. (B) Chromatogram of the bee pollen ethanolic extract. (C) Chromatogram of the propolis ethanolic extract.
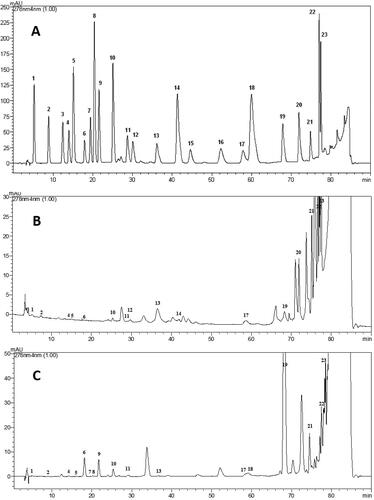
Table 3. Phenolic compounds of bee pollen and propolis ethanolic extracts.
Figure 2. Scavenging activity of propolis and pollen extracts against DPPH radicals at different concentrations.
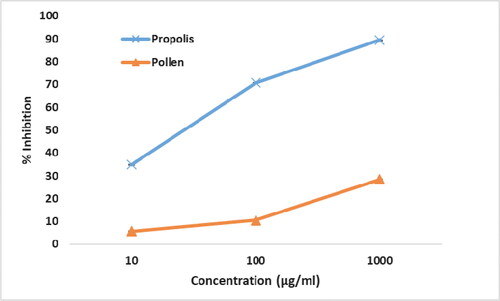
Figure 3. Effects of pollen and propolis extracts on viability of Myeloma cells. MTT assay.
Values are means from 3 independent experiments, with standard deviation (±S.D.)
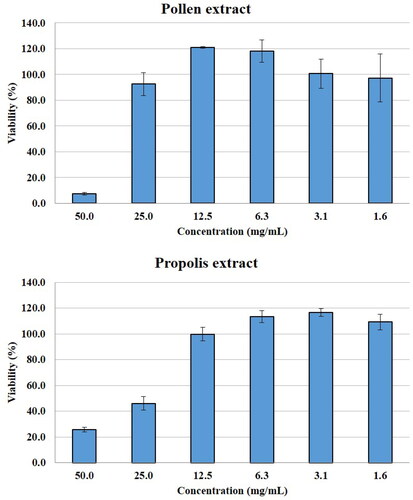
Table 4. Antimicrobial activity of pollen and propolis extracts against selected pathogens using agar well diffusion method (mm).
Table 5. Minimum inhibitory and bactericidal concentrations of bee pollen and propolis extracts against selected pathogens (mg/mL).
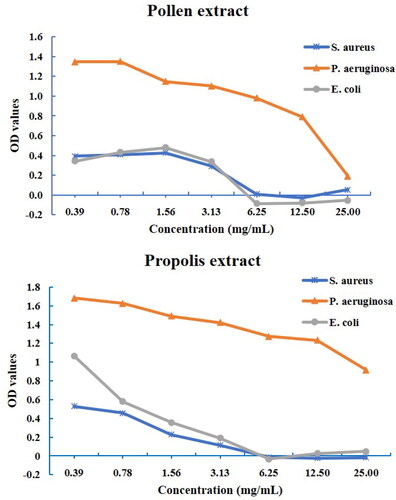
Figure 4. MIC values of the extracts for all tested bacteria.
Data availability statement
The data that support the findings reported in this study are available from the corresponding author upon reasonable request.