
Figures & data
Figure 1. PCR analysis of the CfNFSBI gene fragment and enhanced nitroreductase activity. (a) RT-PCR analysis of the CfNFSBI gene fragment, WT serves as wild-type plant; wild-type and BH216 lines (BH216-3,-5,-6) with actin gene as a reference. (b) Relative transcript levels analyses of different CfNFSBI transgenic Arabidopsis lines. (c) Nitroreductase activity of wild-type and transgenic plants.
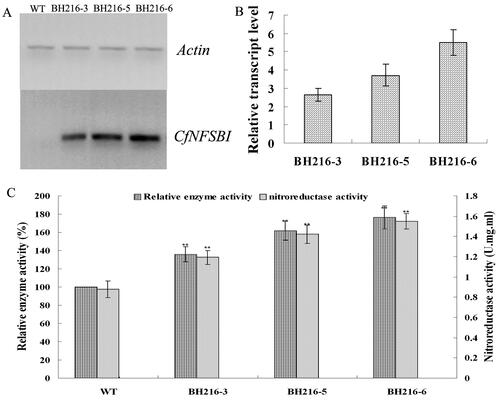
Figure 2. Morphological responses of wild-type and transgenic plants under different concentrations of TNT. (a) Wild-type (WT) and BH216 plants germinated and grown vertically for 2 weeks on half-strength MS agar plates containing 0, 25 and 50 μmol L−1 TNT. (b) Root length of 2-week-old WT and BH216 plants grown on half-strength MS agar plates containing 0, 25 and 50 μmol L−1 TNT. The data represent mean values ± SD (n = 10).
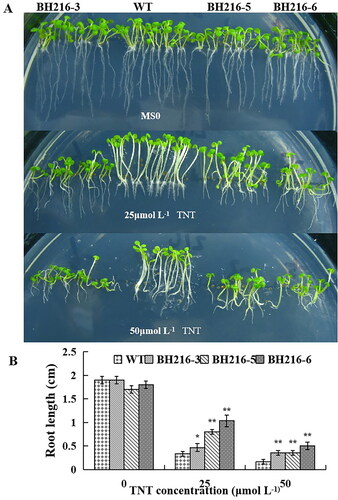
Figure 3. Enhanced TNT tolerances of plants on plates. (a) Effects of TNT on the seedling growth on MS agar plates containing 0, 50, 100 and 150 μmol L−1 TNT. (b) Survival rate of seedlings on MS agar plates containing 0, 50, 100 and 50 μmol L−1 TNT. The data represent mean values ± SD (n = 50).
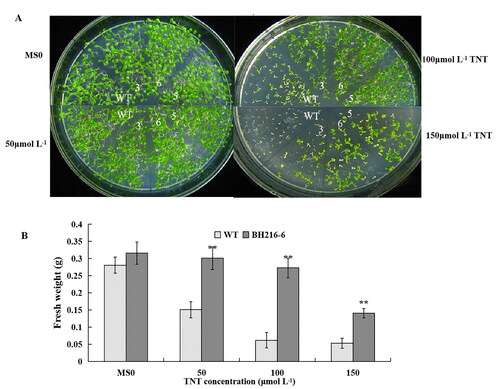
Figure 4. Growth of wild-type and transgenic line in liquid medium. (a) Thirty seedlings grown in MS solid medium for 2 weeks were transferred to MS liquid medium in flasks containing 0, 50, 100 and 150 μmol L−1 TNT. (b) Increased fresh weights of seedlings in the individual flasks in the above treatment. The data represent mean values ± SD (n = 3).
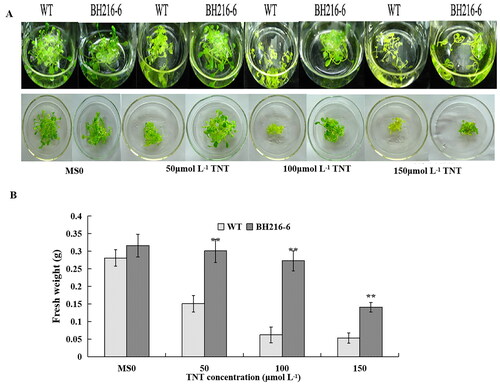
Figure 5. Effect of TNT treatment on photosynthetic activities. (a) Chlorophyll (Chl) changes in wild-type and transformed plants. (b) Fv/Fm changes in wild-type and transformed plants. Wild-type and transformed plants grown in soil for 4-week-old and then soaked with 0, 250, 500 and 750 μmol L−1 TNT for a week. The data represent mean values ± SD (n = 3).
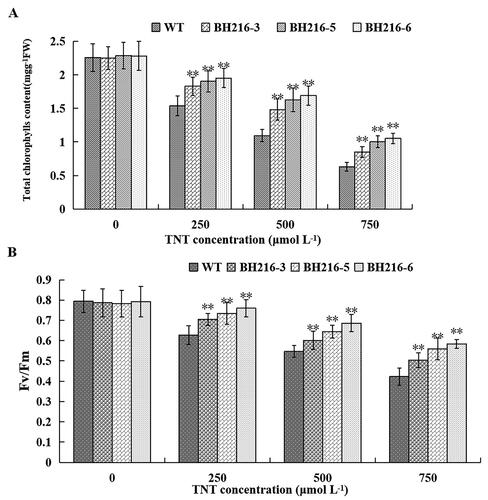
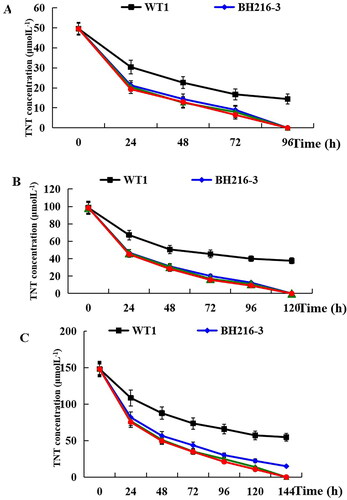
Figure 6. Transformation of TNT by wild-type and transgenic seedlings. Wild-type and transgenic seedlings were incubated with 50, 100 and 150 μmol L−1 TNT in MS liquid medium (a–c).
Data availability
The data supporting the findings of this study are available from the authors upon reasonable request.