
Figures & data
Table 1. Findings of ectodermal dysplasia cases participating in the study.
Figure 1. (a,b,c) Increasing number of teeth with caries, missing teeth and shape anomalies in ED cases.
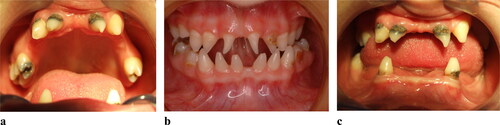
Figure 2. Appearance of enamel prisms and enamel mineral measurements in a normal healthy case as a control case.
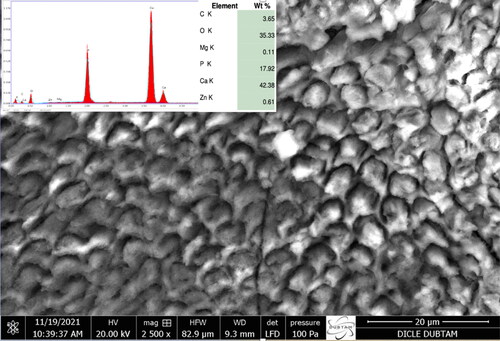
Figure 3. Appearance of dentin canals (3 µm – 4 µm) and dentin mineral measurements in the dentin of a normal healthy case.
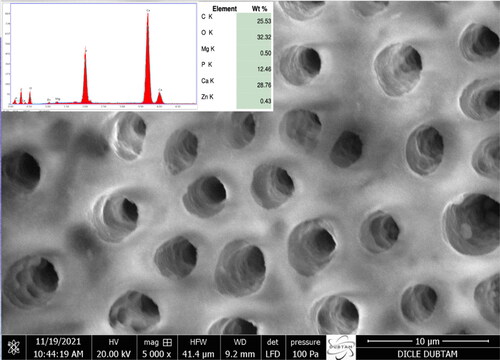
Figure 4. Appearance of irregular enamel prisms and enamel mineral measurements in an ectodermal case.
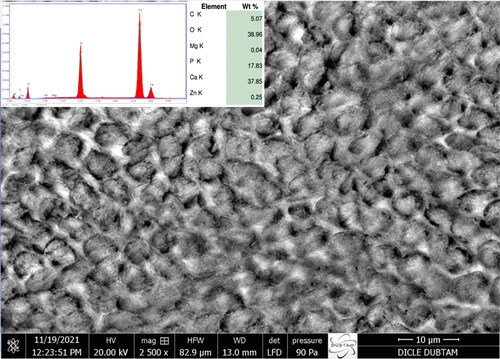
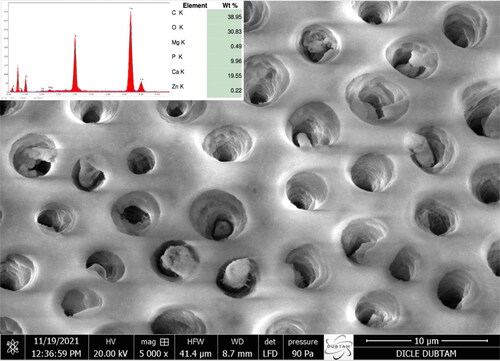
Figure 5. Appearance of large formed dentin canals (4 µm – 5 µm) and dentin mineral measurements in an ectodermal dysplasia case.
Data availability statement (DAS)
Data are available upon reasonable request due to privacy if necessary.