
Figures & data
Figure 1. Preoperative (А) and postoperative (B) OCT + OCTA of SCP in а patient with FTMH. The structural OCT shows full thickness macular hole, and OCT-A images of SCP demonstrate enlargement of the FAZ area before surgery (А). The structural OCT shows the closure of macular hole after the surgery, and OCT-A images of SCP demonstrate reduction in the size of the FAZ area (B). Note: OCT: optical coherence tomography; OCTA: optical coherence tomography angiography; FTMH: full thickness macular hole; SCP: superficial capillary plexus; FAZ: foveal avascular zone.
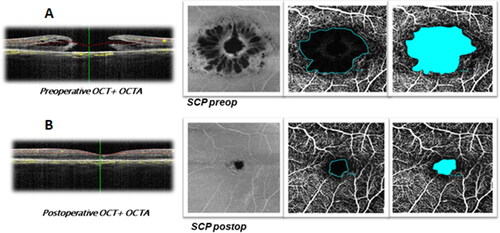
Figure 2. Preoperative (A) and postoperative (B) OCTA of DCP in a patient with FTMH. OCT-A images of DCP demonstrate enlargement of the FAZ area before surgery (A) and reduction in the FAZ area after surgery (B). Note: OCT: optical coherence tomography; OCTA: optical coherence tomography angiography; DCP: deep capillary plexus; FAZ: foveal avascular zone.
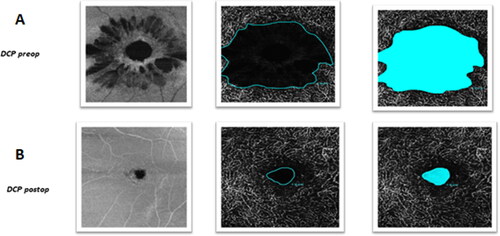
Table 1. Comparative characteristics before and after MH surgery.
Table 2. Comparative characteristics of operated and control eyes 1 month after MH surgery.
Figure 3. Preoperative (A) and postoperative (B) OCT + OCTA of SCP in a patient with ERM. The structural OCT shows ERM with cystoid intraretinal changes and absence of foveal pit, and preoperative OCTA of SCP demonstrate distotsion and reduction in the FAZ area before surgery (A). Structural OCT shows residual intraretinal changes after ERM removal (B). Note: OCT: optical coherence tomography; OCTA: optical coherence tomography angiography; SCP: superficial capillary plexus; FAZ: foveal avascular zone.
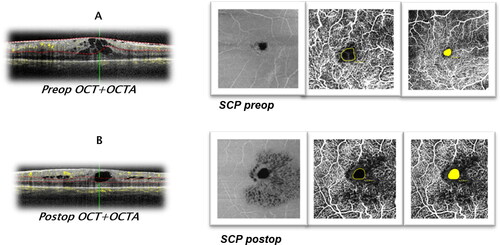
Table 3. Comparative characteristics before and after surgery for ERM removal.
Table 4. Comparative characteristics of operated and control eyes 1 month after surgery for ERM removal.
Data availability statement
The data supporting the findings of this study are available from the authors upon reasonable request.